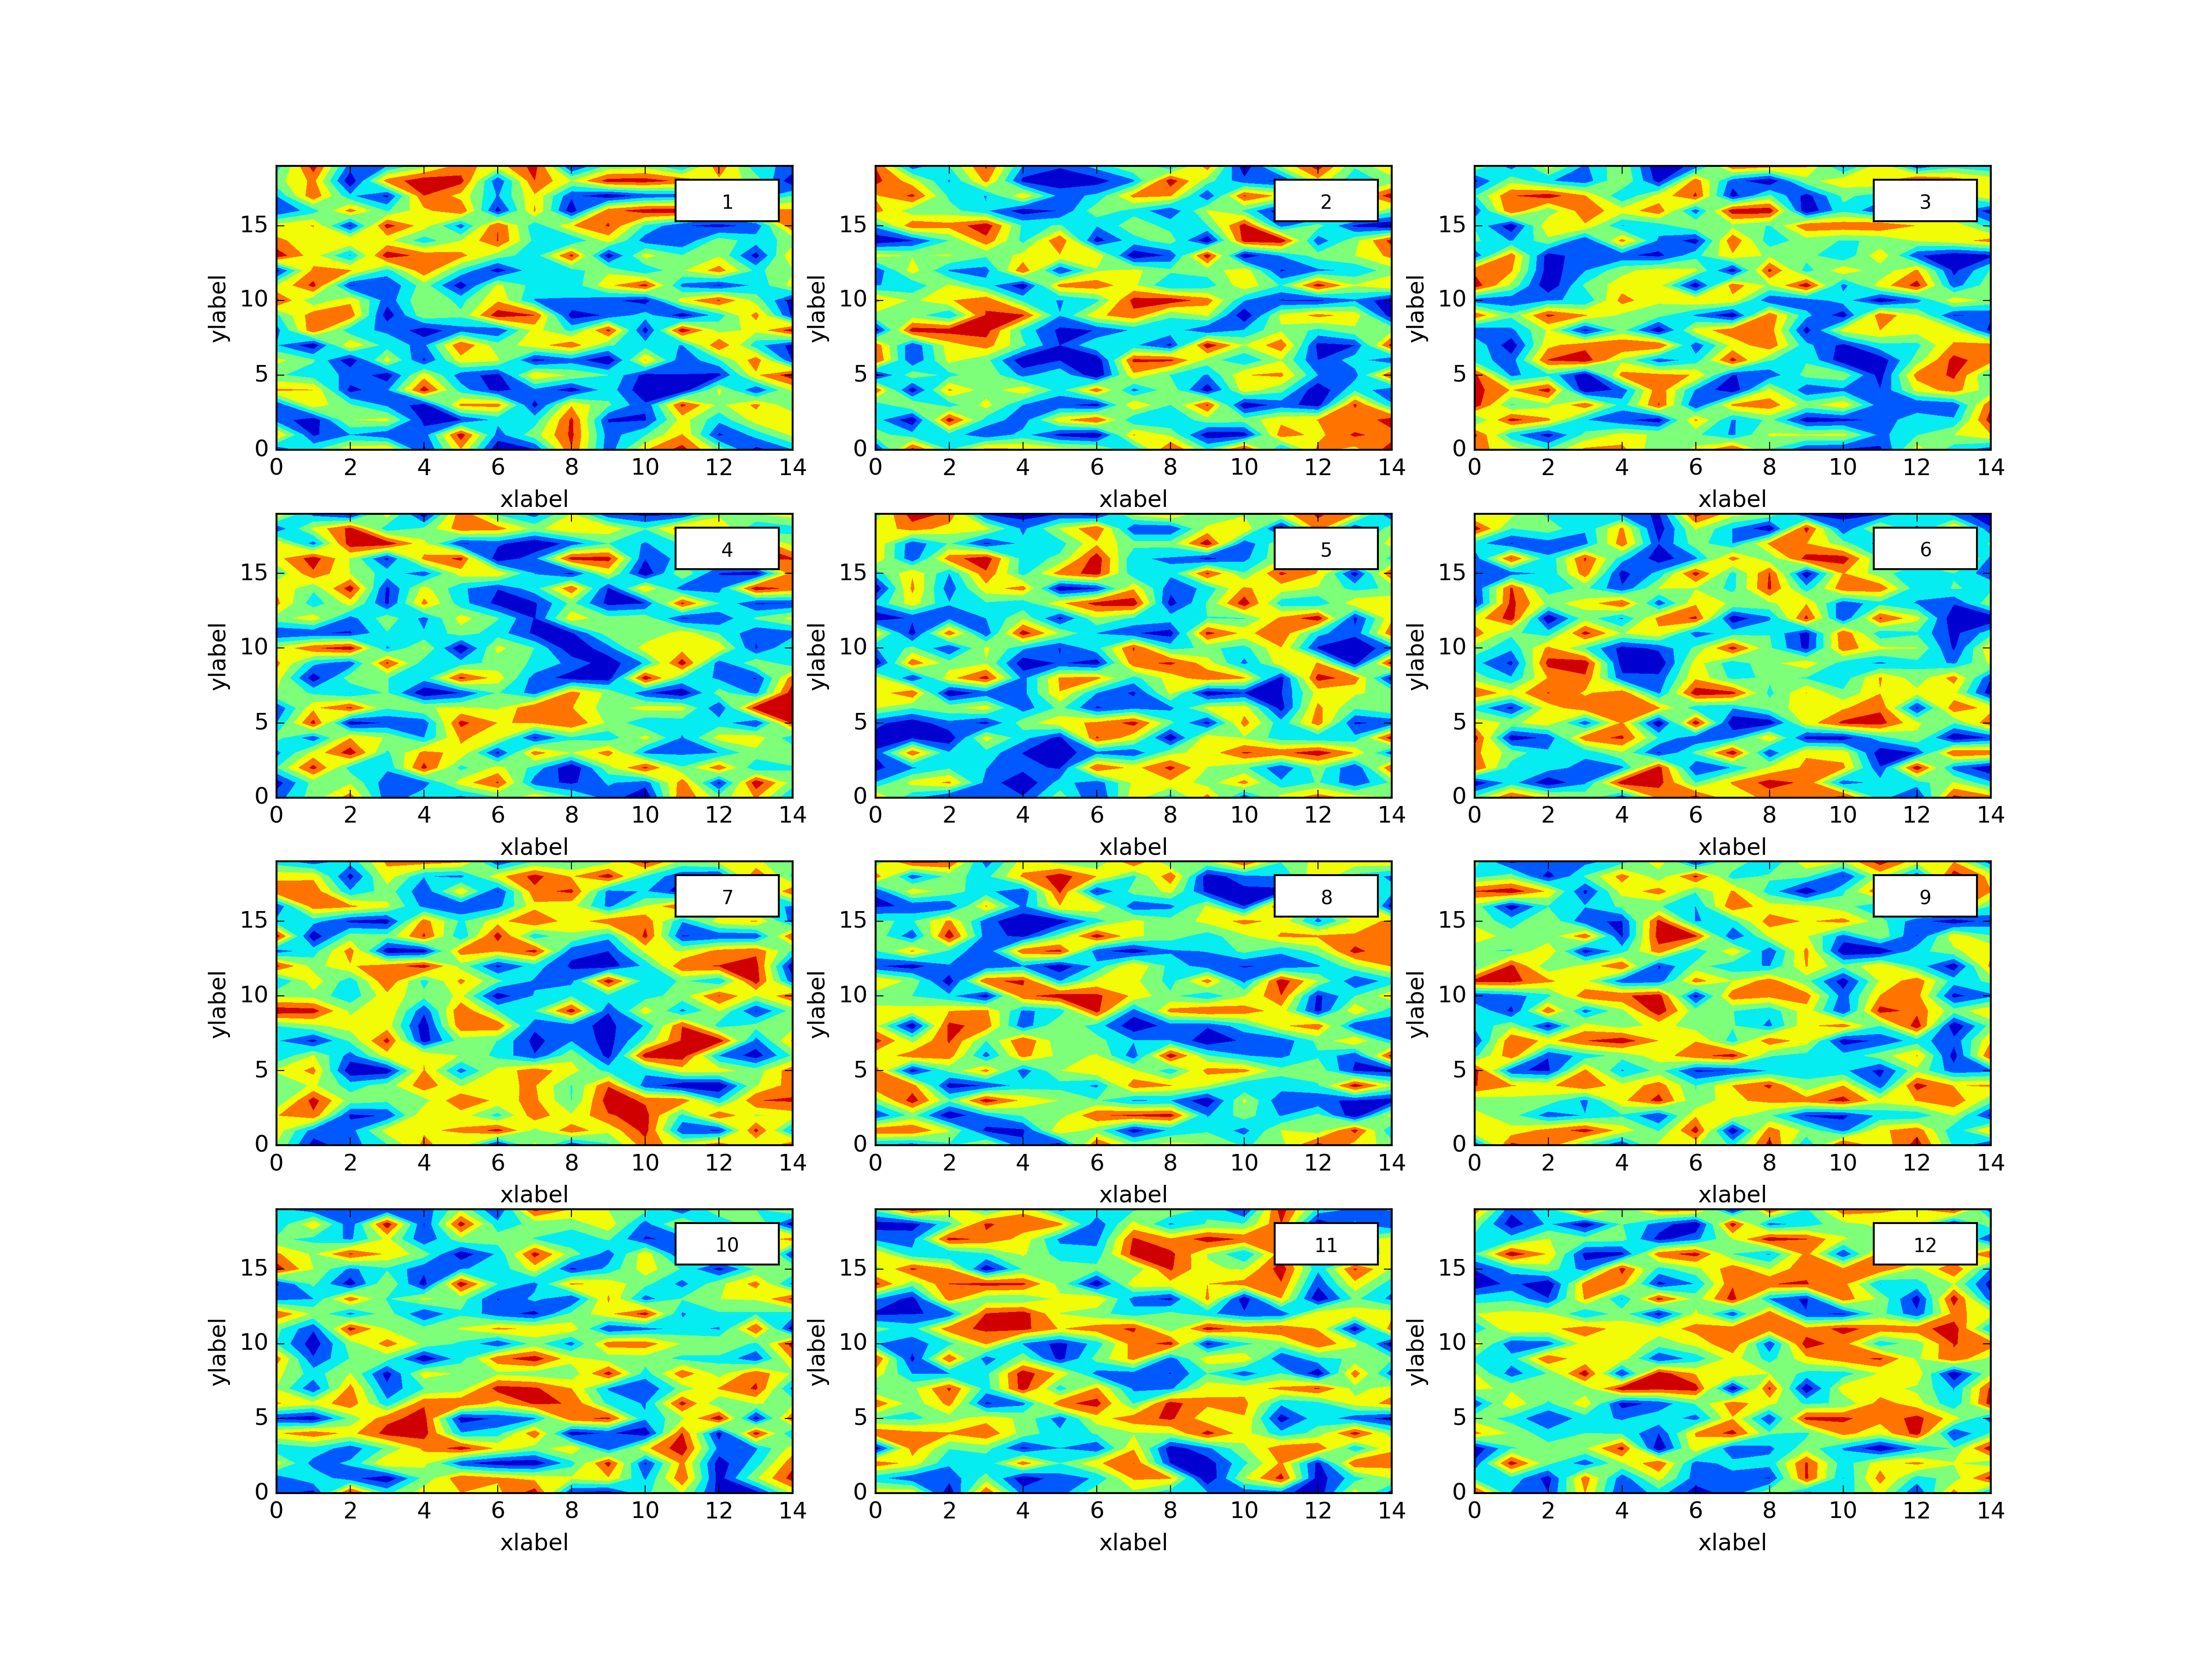
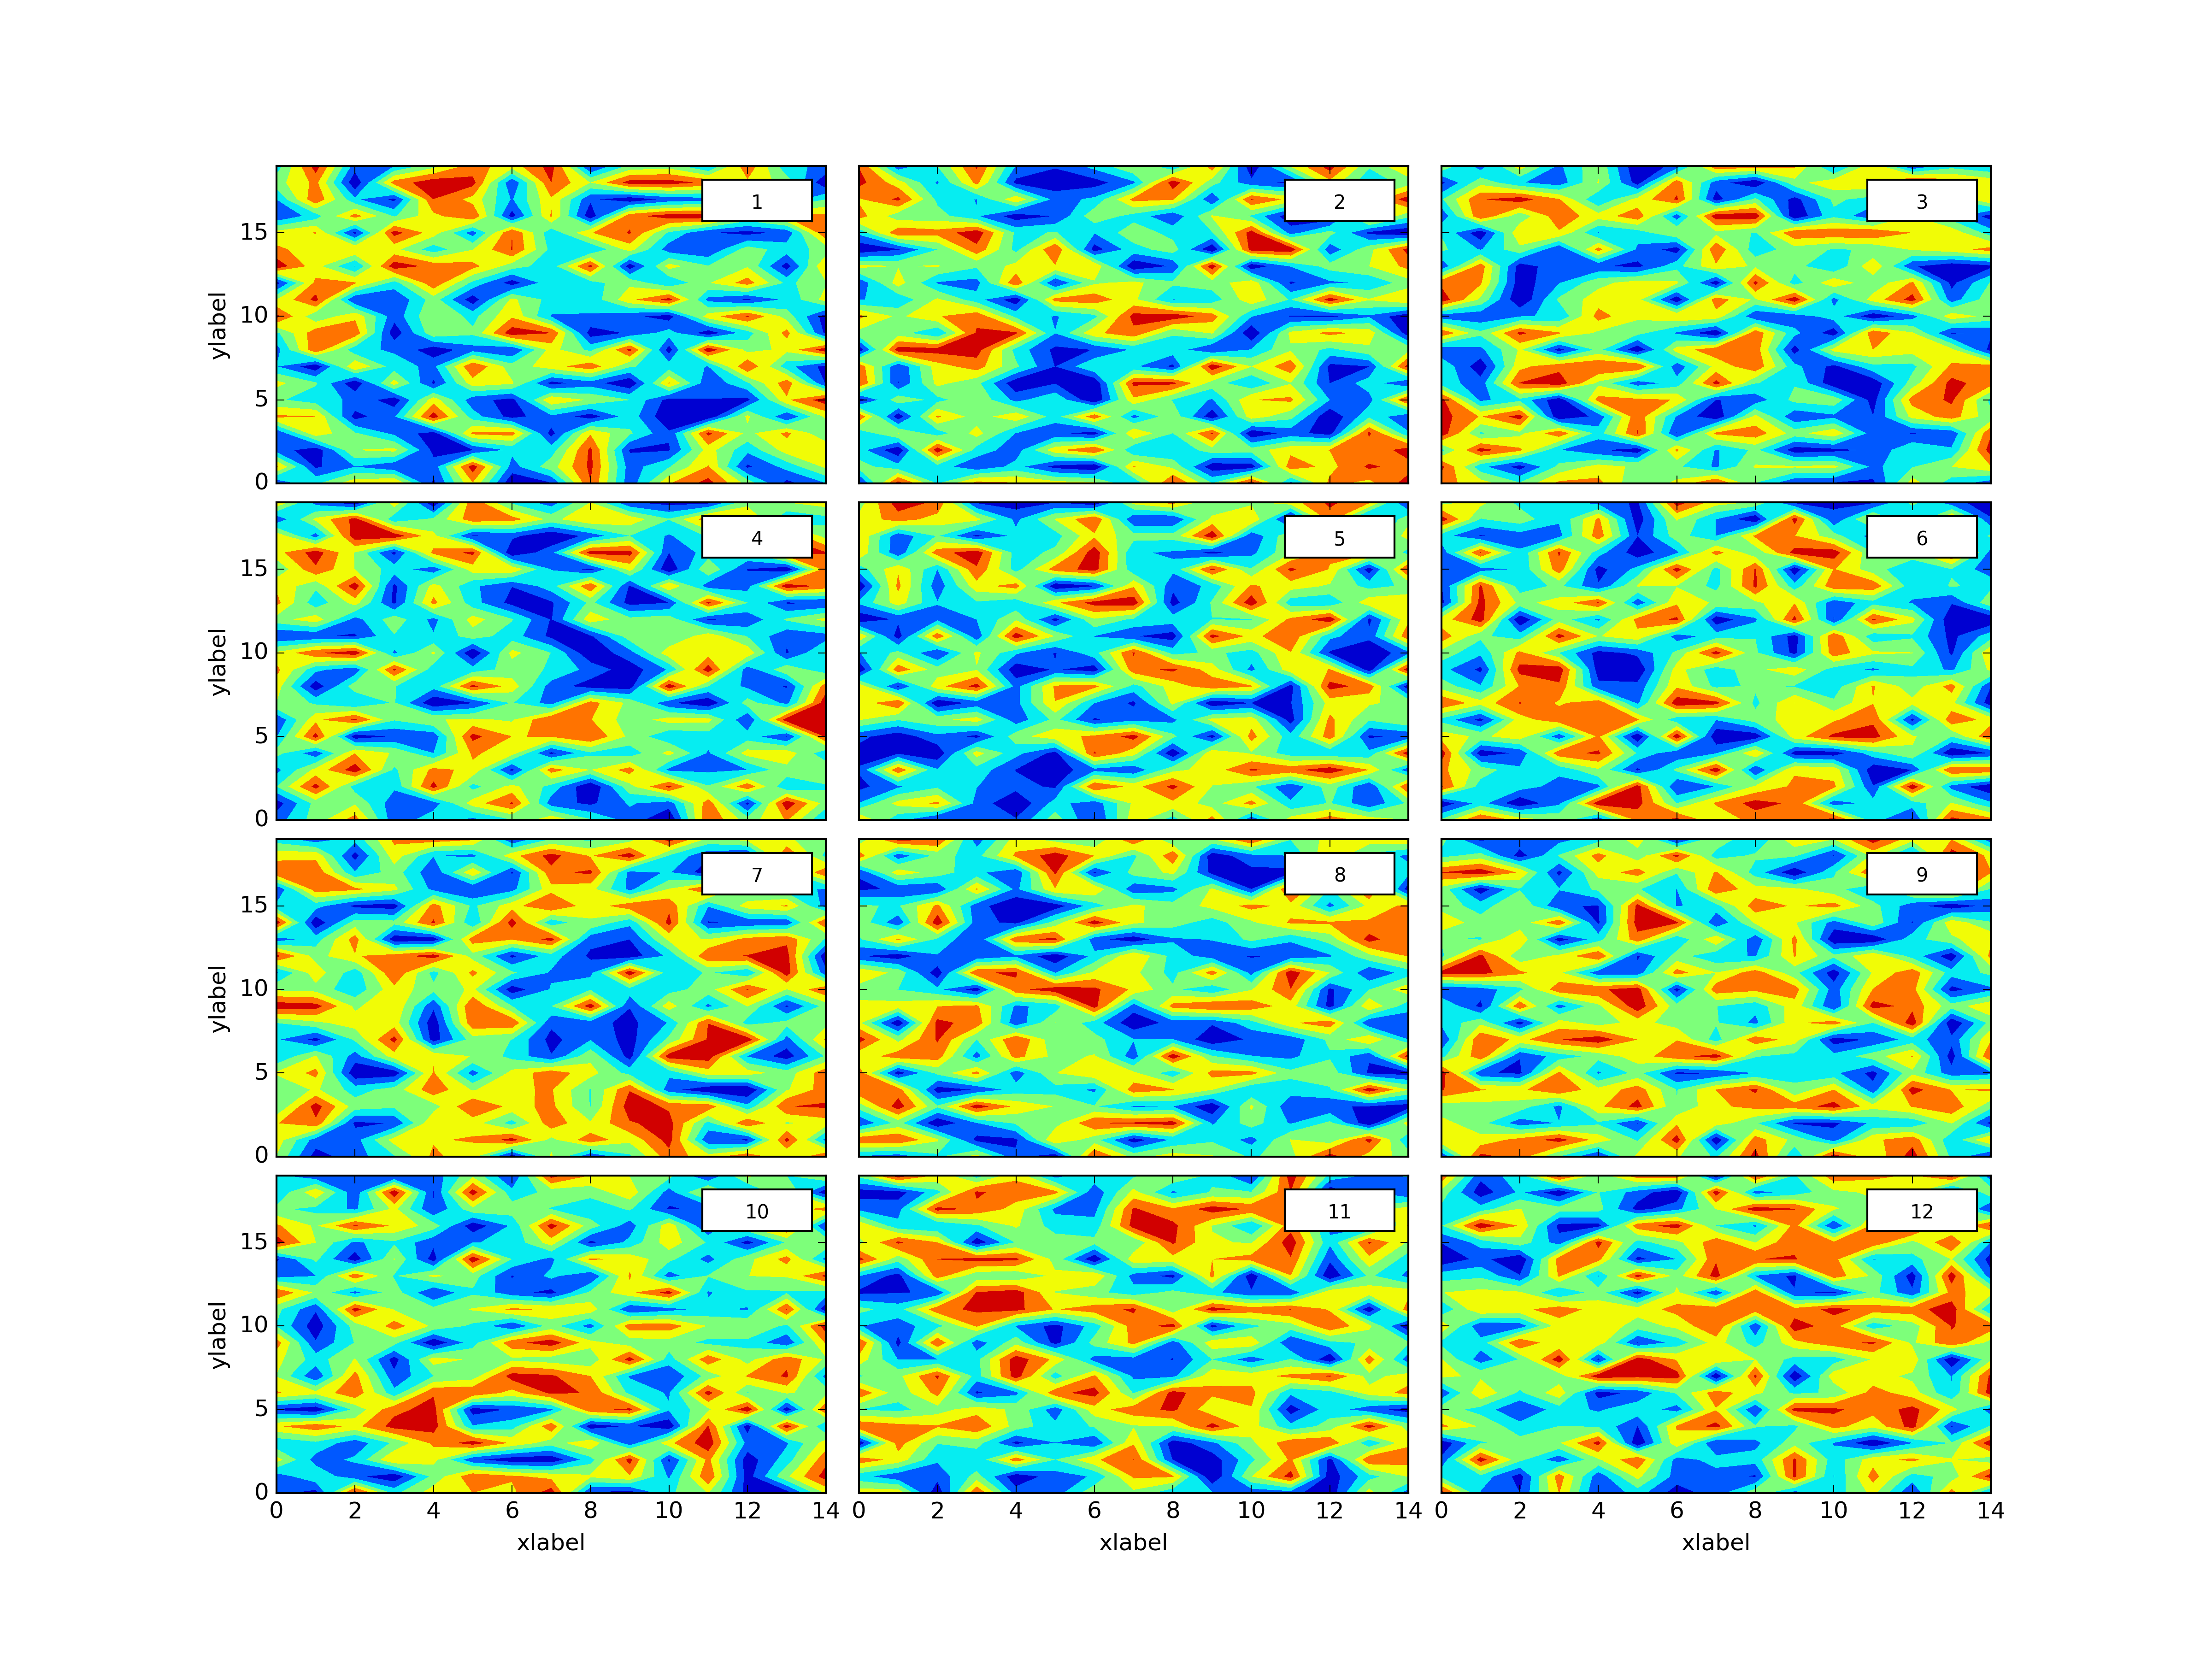
Plthacks is a Python package that wraps Matplotlib to make common (tedius) tasks faster, this post is about creating a grid of an arbitrary number of plots from an ordered dictionary.
I reguarly find myself wanting to display multiple fields. I find it frustrating how many lines you need in Matplotlib to grid plots such that they have things like:
- when sharing an axis removing ticks and labels where appropriate;
- displaying one colourbar for each subplot or a global colourbar for all plots;
- adjusting subplot size according to the above.
Plthacks.Grid Class is an attempt to make this much faster. Let’s see an example.
This package is under development, this post refers to this SHA of the code.
‘Install’ the package somewhere you’ll import it..
git clone https://github.com/chrisb13/plthacks
cd plthacks
git reset --hard 5b193d89ae018aa8a0822c5d722f4dcad2f345c1
To start, we’ll just create some data and store it in an ordered dictionary called plotdict. We also optionally specify each subplot’s dimension labels and colorbars, called dimlab and colorbars respectively.
import plthacks as plth

#this package requires numpy and matplotlib
import numpy as np

#these two are part of core python
import collections
import itertools

#place to put the plot, if an output is not specified (when calling Grid Class), then it will return the matplotlib figure object
plotoutputs='/tmp/testplots/'

#we will show how you can specify different colormaps in a minute
colormaps=itertools.cycle(['Accent', 'Dark2', 'Paired', 'Pastel1',\
        'Pastel2', 'Set1', 'Set2', 'Set3'])

#The following three ordered dictionaries are ordered by each subplot where they contain:
#plotdict is the fields to contourf
plotdict=collections.OrderedDict()
#(optional) dimlab is the labels for the x/y axis
dimlab=collections.OrderedDict()
#(optional) colorbars are the colourmaps to use
colorbars=collections.OrderedDict()

#this will be the title in the box of each subplot, we are making 12 but you can try a different number if you like...
cnts=[str(cnt) for cnt in np.arange(12)+1]

for cnt in cnts:
    #plotdict[cnt]=np.random.rand(200,150)
    plotdict[cnt]=np.random.rand(20,15)
    dimlab[cnt]=('xlabel','ylabel')
    colorbars[cnt]=colormaps.next()
We’ll now show 10 different usages of the Grid class so you get the idea of what it can do.
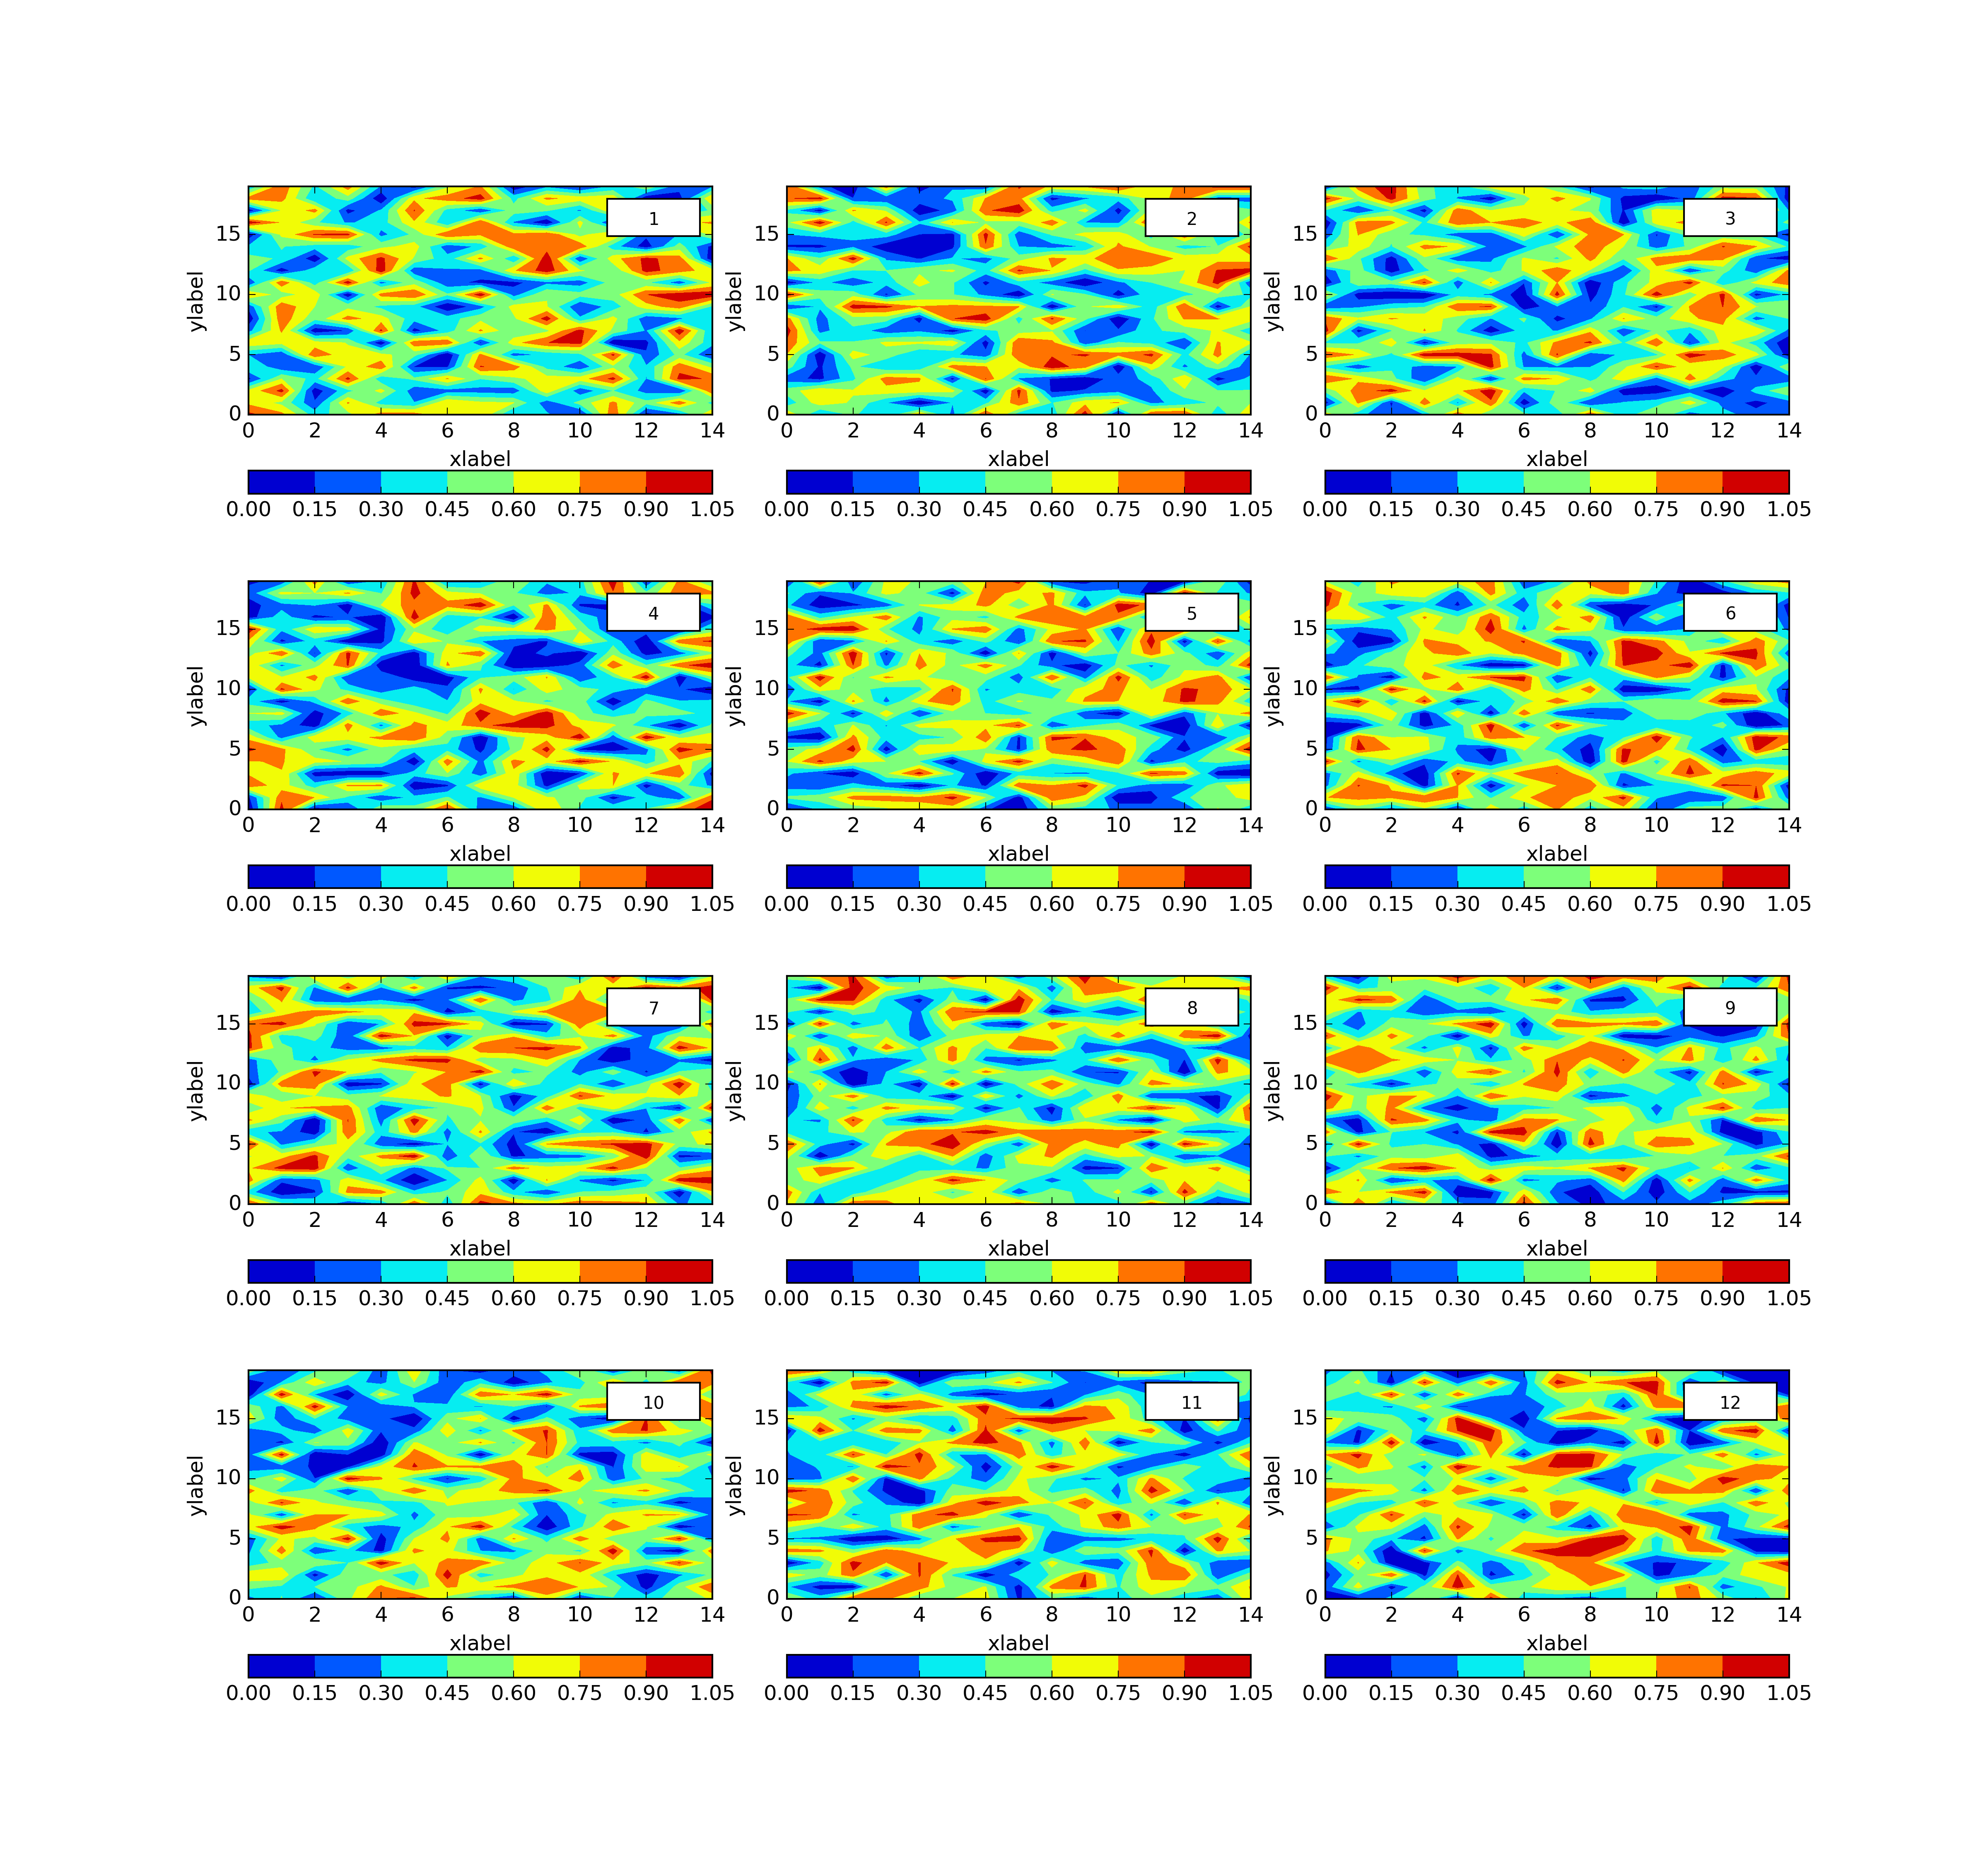
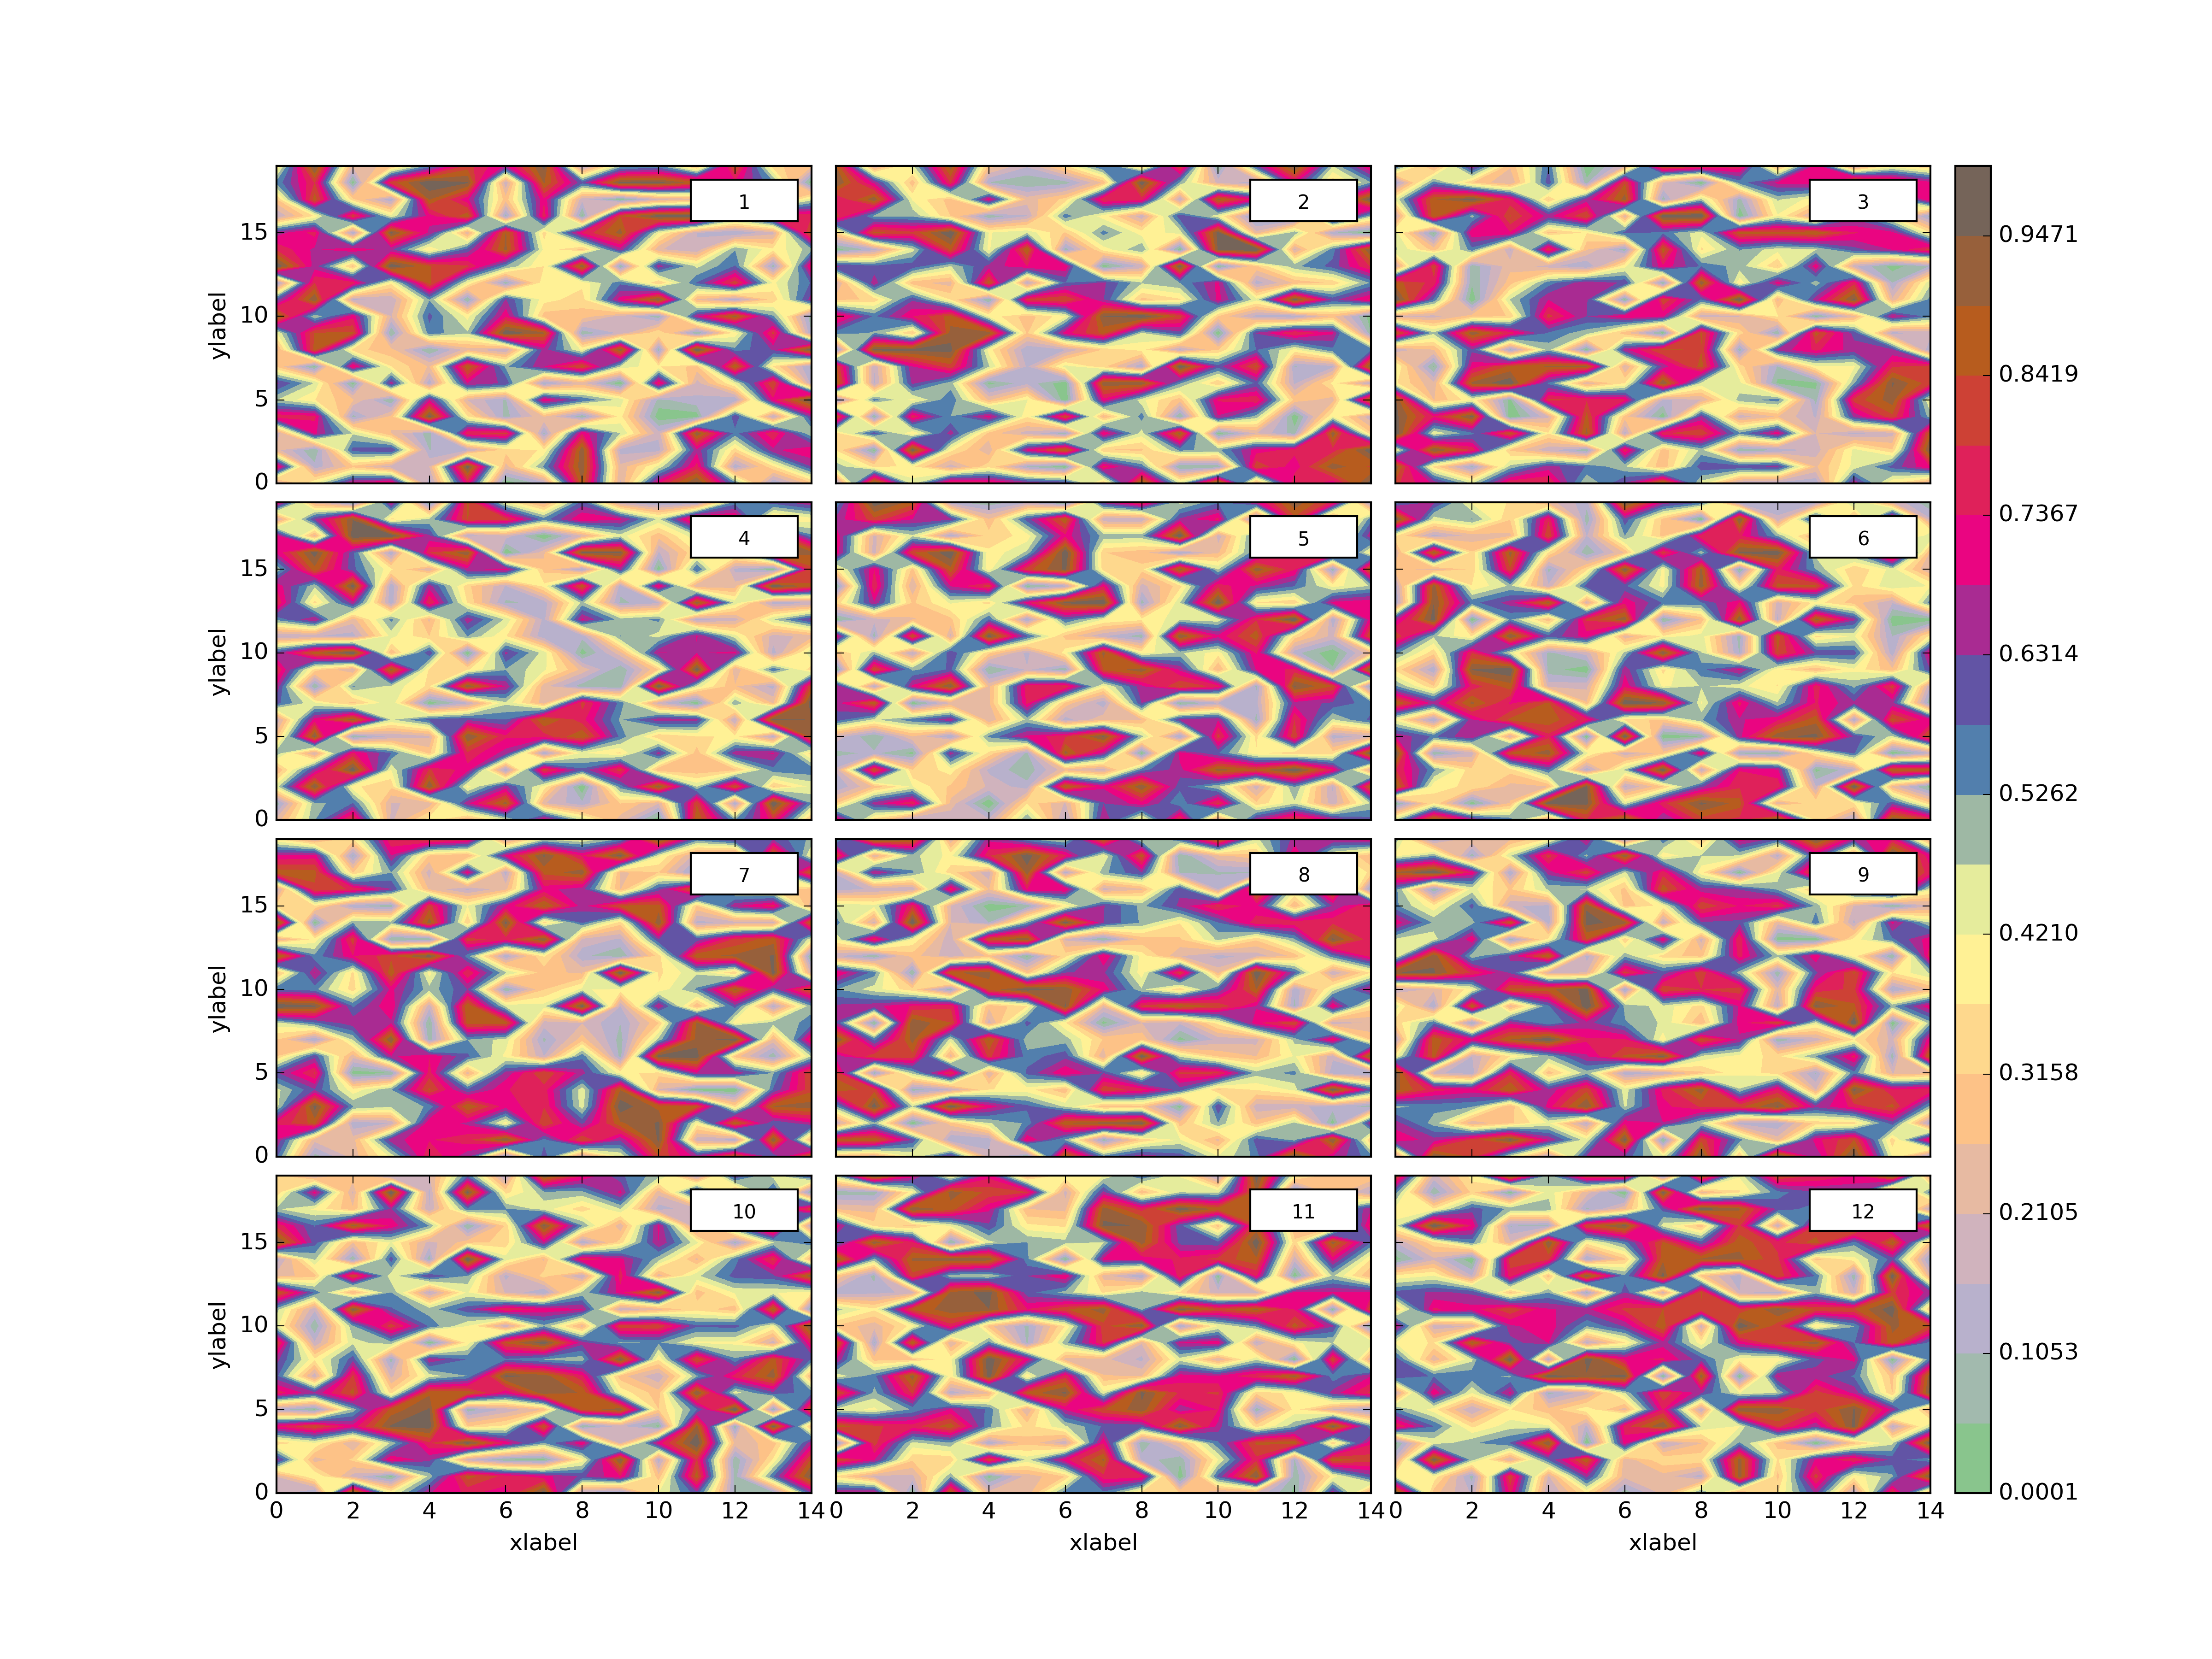
plth.Grid(plotdict,(4,3),dimlabels=dimlab,sepcbar=True,outputpath=plotoutputs+'001_GridEgDimLabSepcbar.png')Neat right? So you’ll notice we’ve opted for 4 rows and 3 columns with 12 plots but the grid can be whatever we like (I hope!).
We can do a few other things too, such as:
- share x-axis/share y-axis
- include/exclude dimension labels
- include/exclude local or global colourbar(s)
- have different colourmaps for each subplot
These options are described in the Grid docstring:
"""
Class to create a gridded set of subplots from a dictionary.

Parameters
----------
pdict: dictionary containing the arrays to plot, titles are taken from the key
pdims: tuple with (rowdim,coldim)
sharex (optional): share all the x axis in the grid
sharey (optional): share all the y axis in the grid
dimlabels (optional): dictionary containing tuples of xlabel and ylabels
sepcbar (optional): separate colorbars for each subplot (True or False)
globalcbar (optional): a single colorbar for the whole plot (string where the options are: 'True' which will use default colormap or name of matplotlib colormap)
cbars (optional): dictionary containing matplotlib colourbars to use
clevels (optional): integer for the number of contour levels
outputpath (optional): full path of file to put plot in (if left out it won't be created)

Returns
-------

Notes
-------
* If you use sepcbar, then best not to use sharex or sharey.
You’ll notice in the above example we used the optional dimlabels and sepcbar. Here’s some more examples.
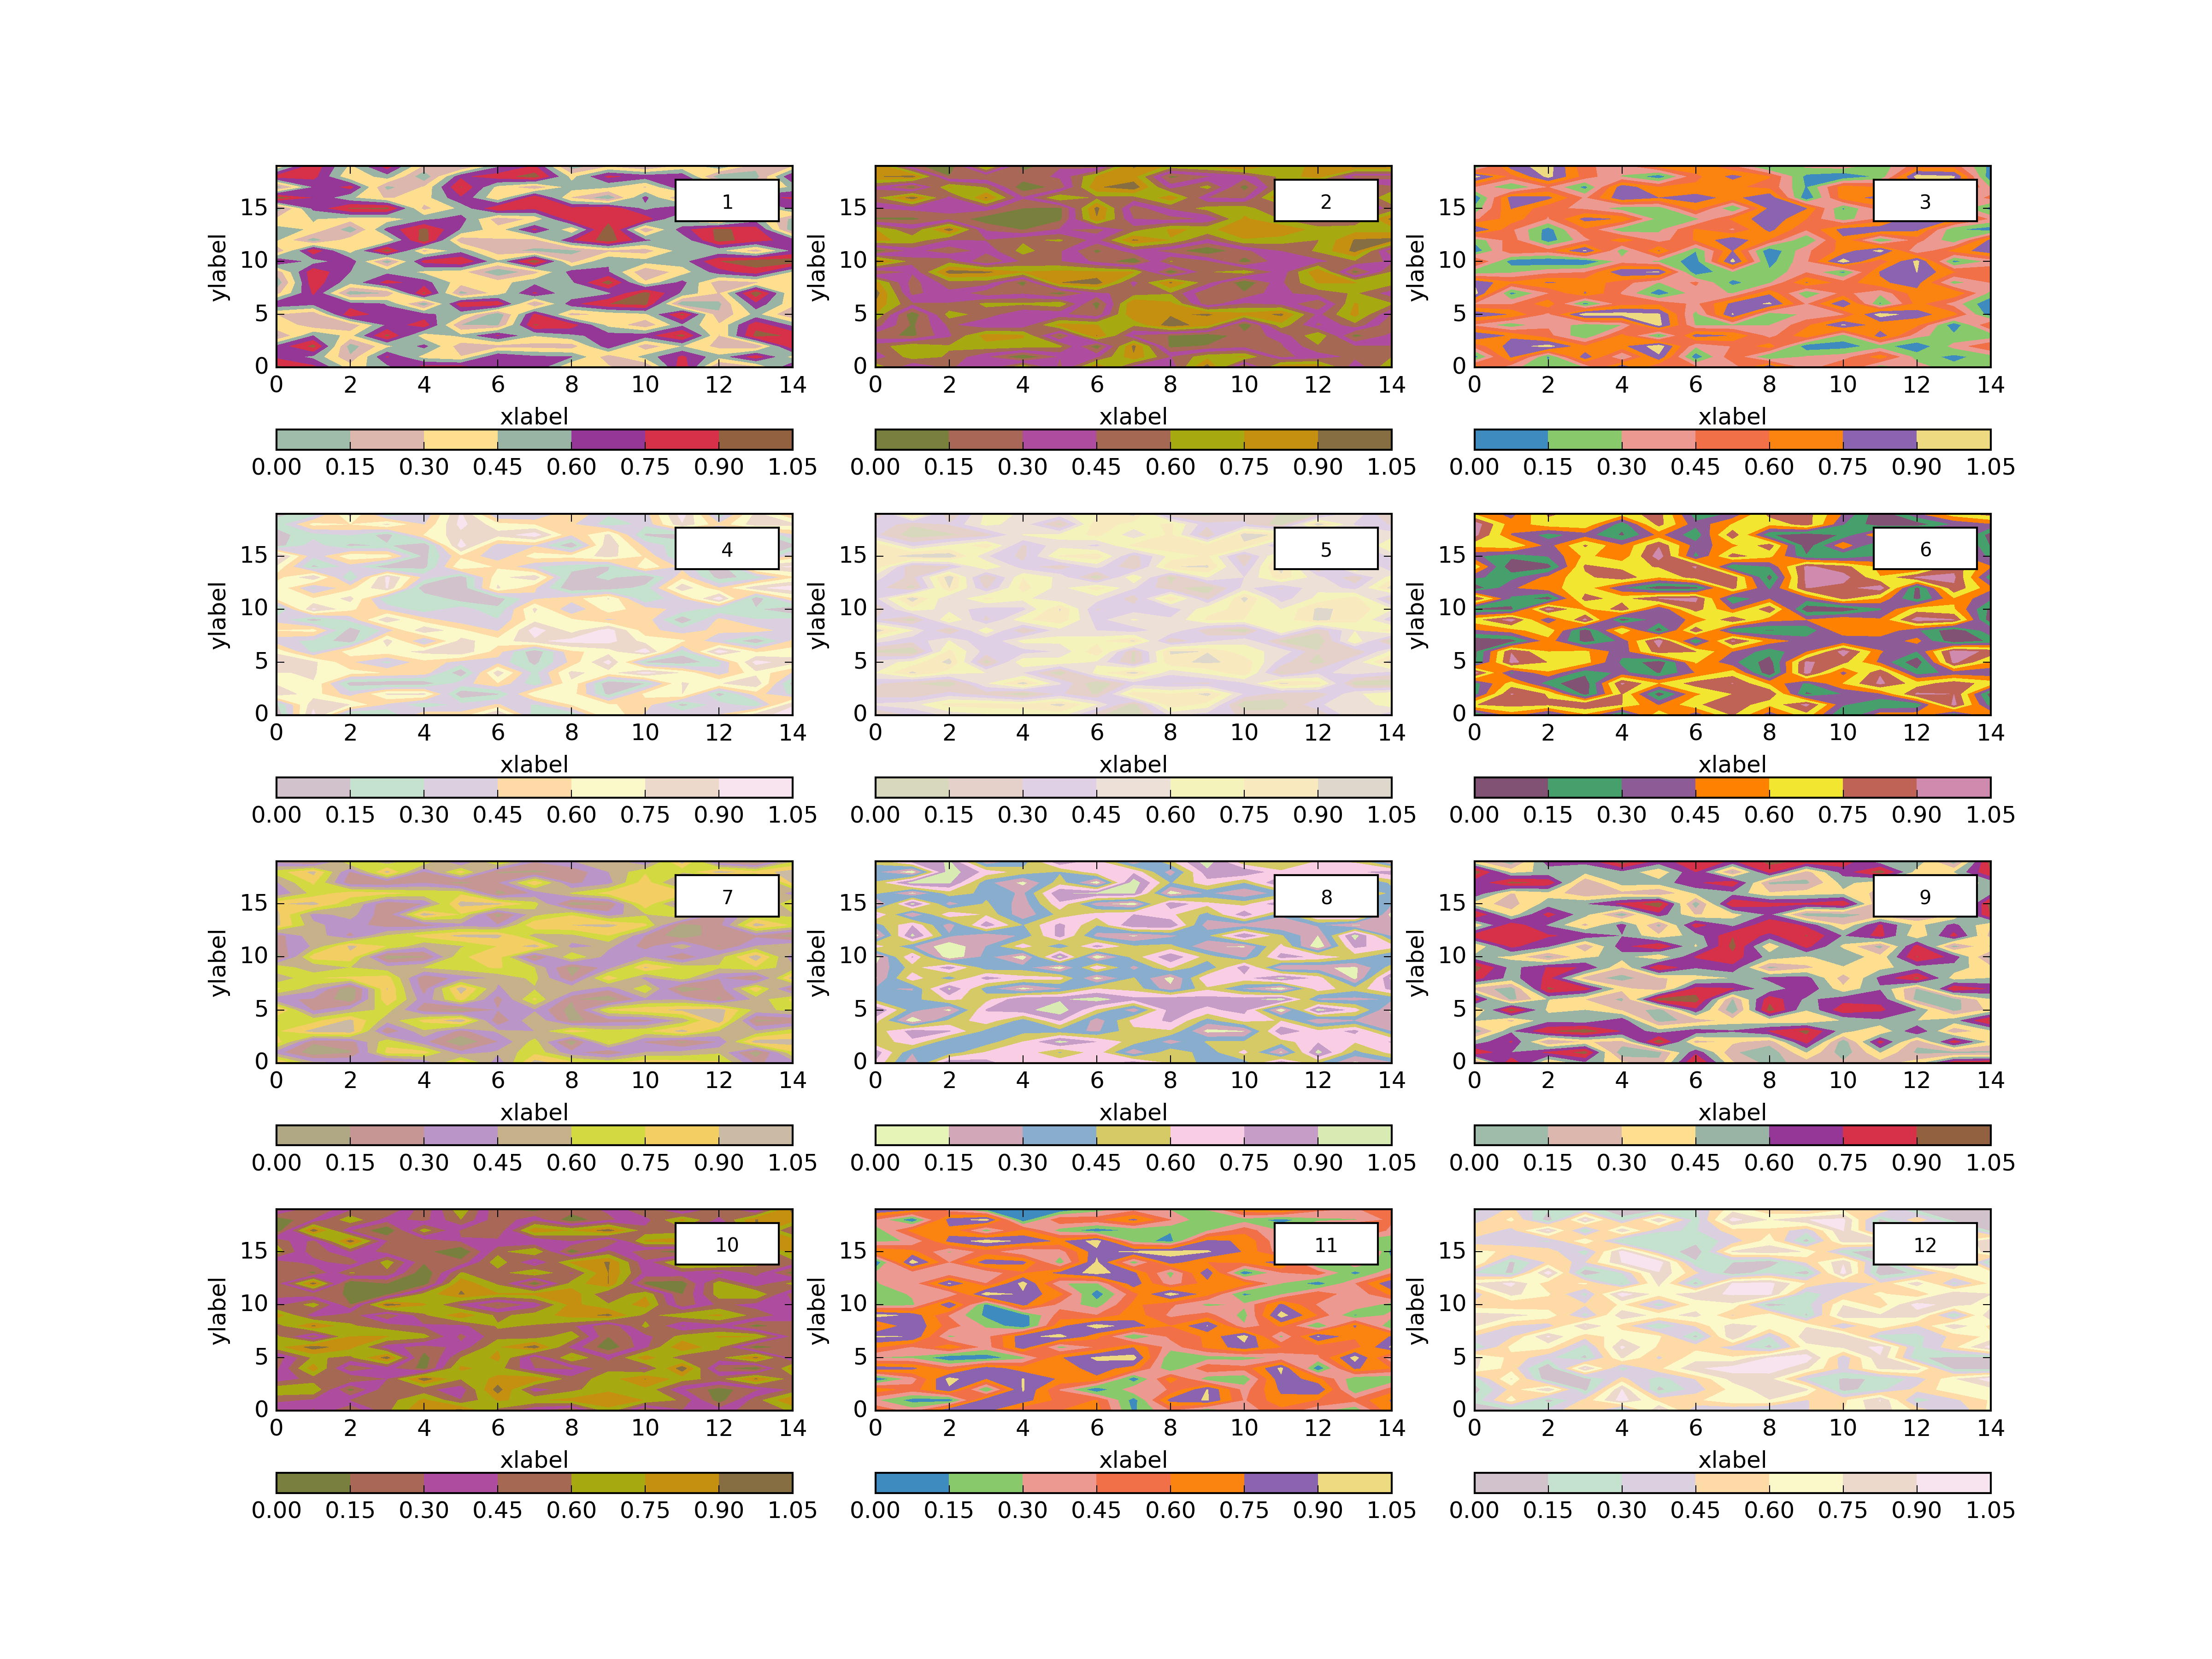
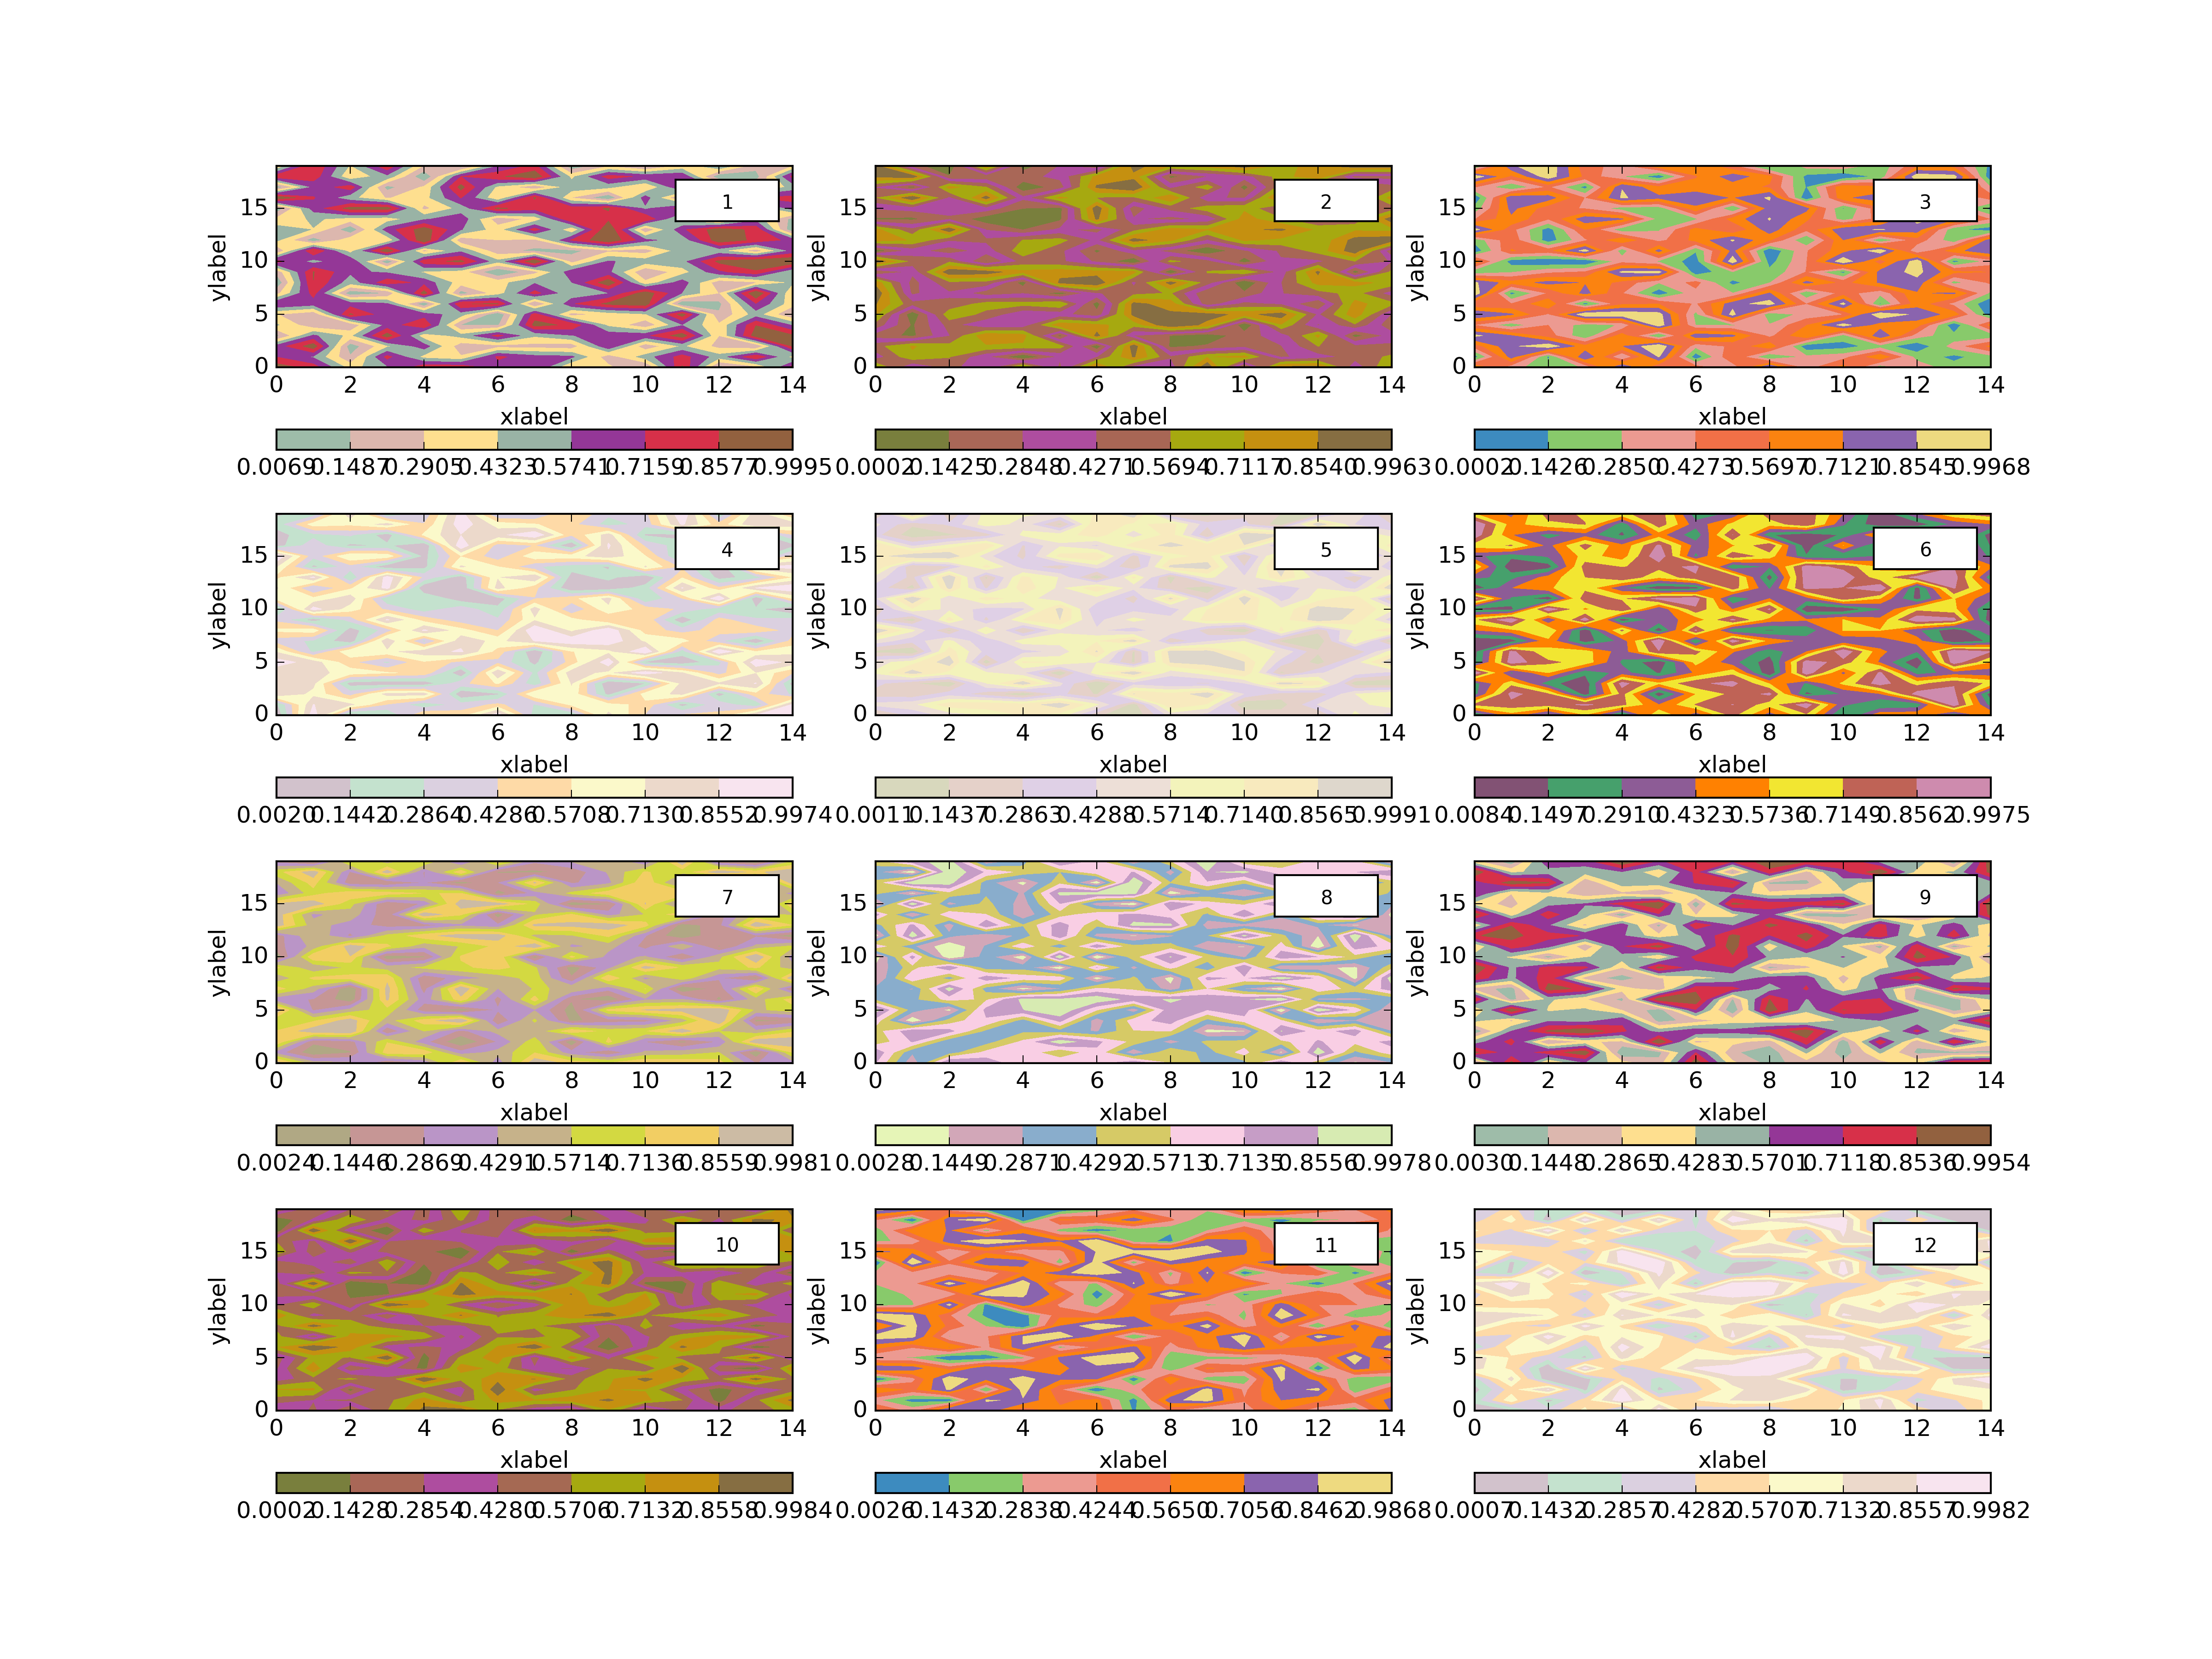
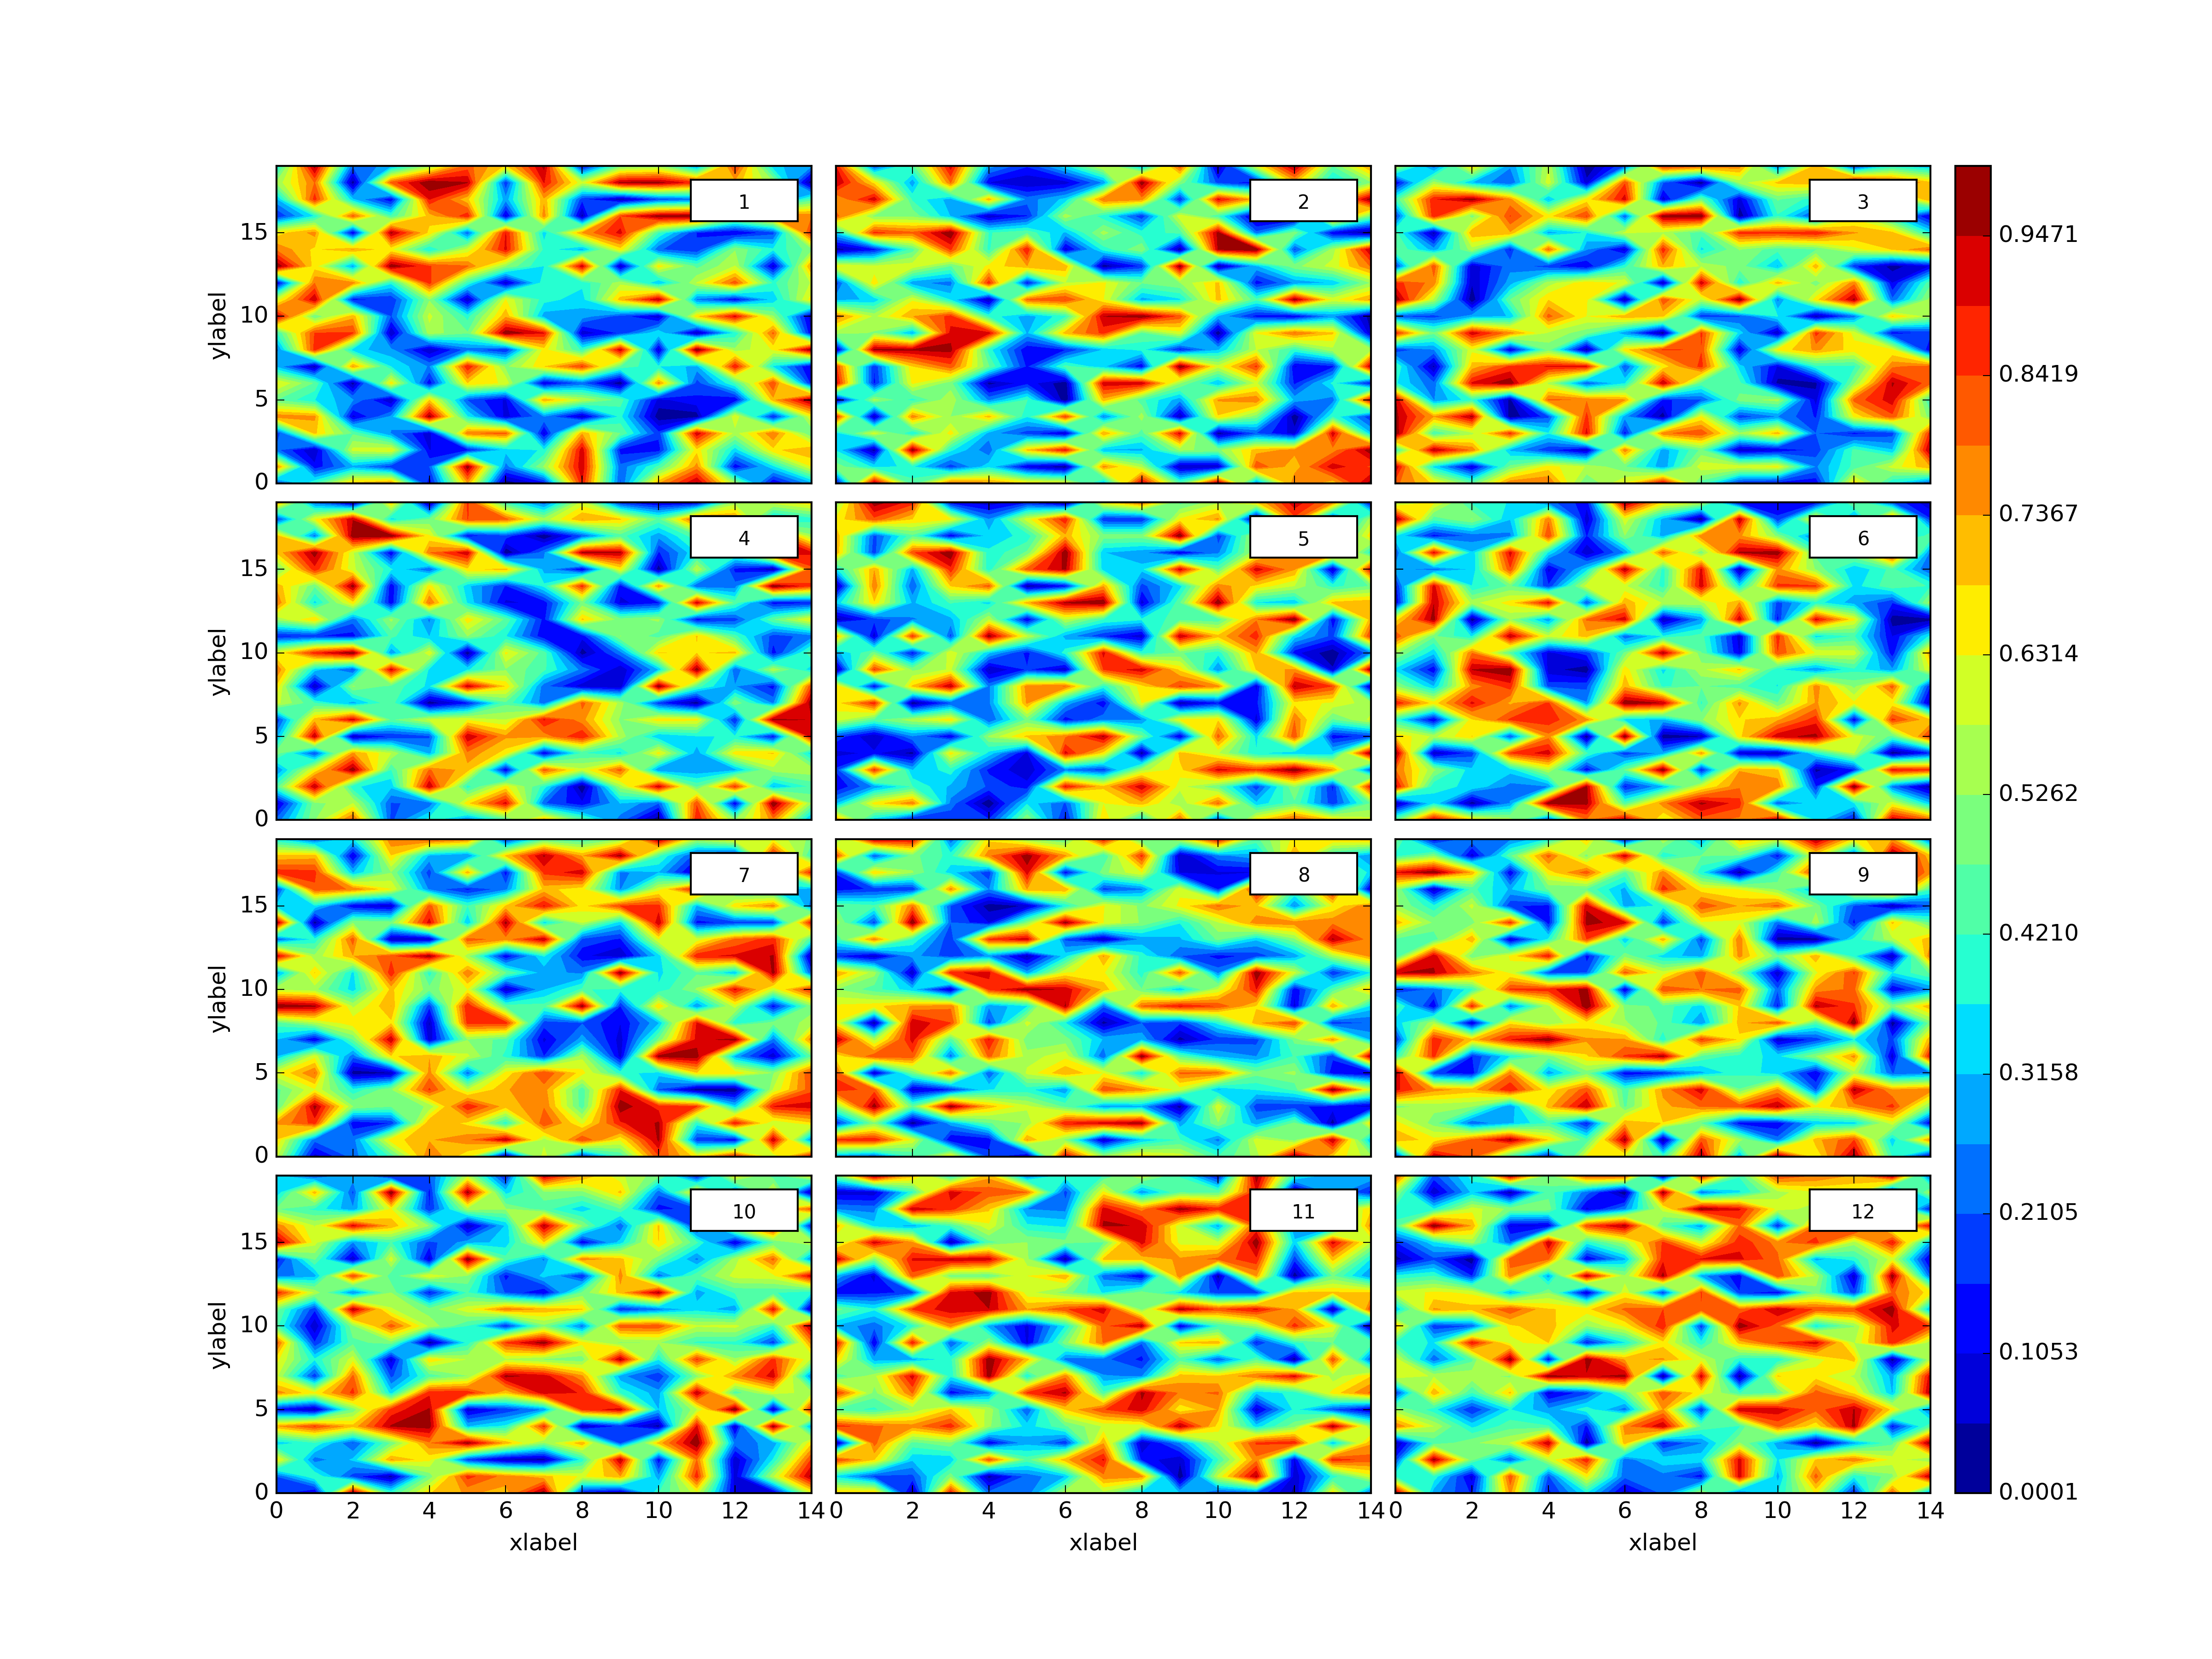
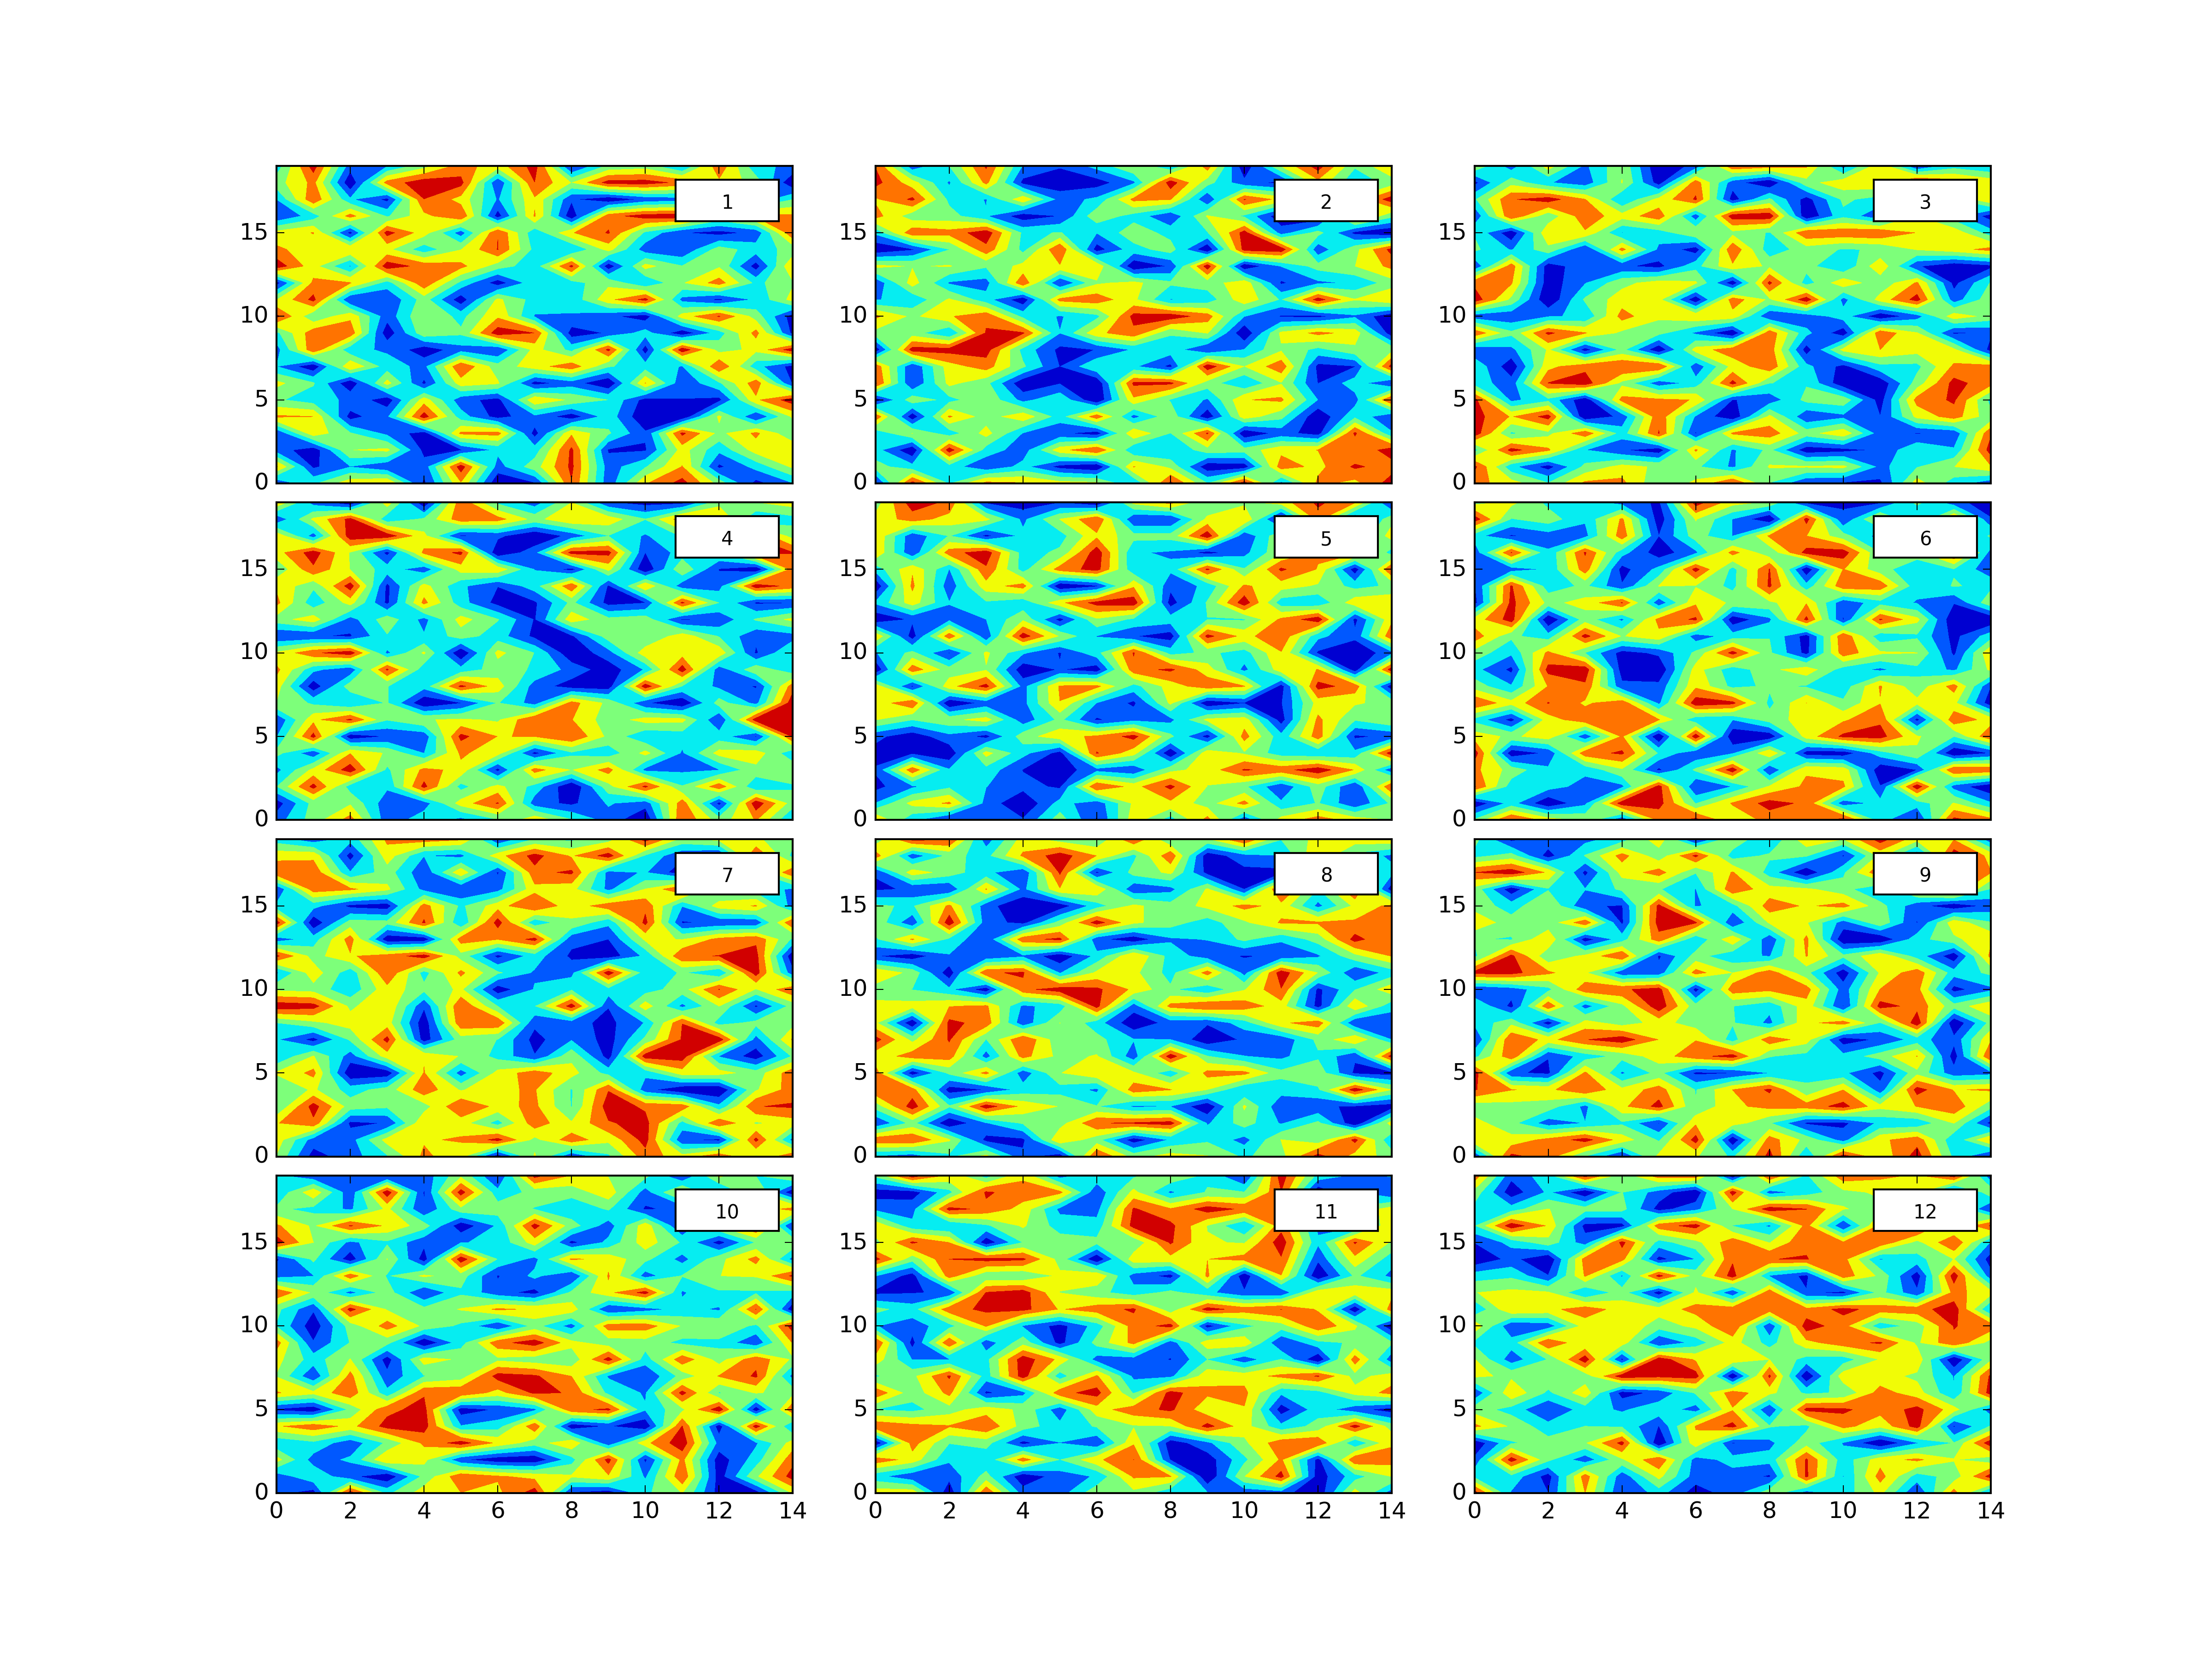
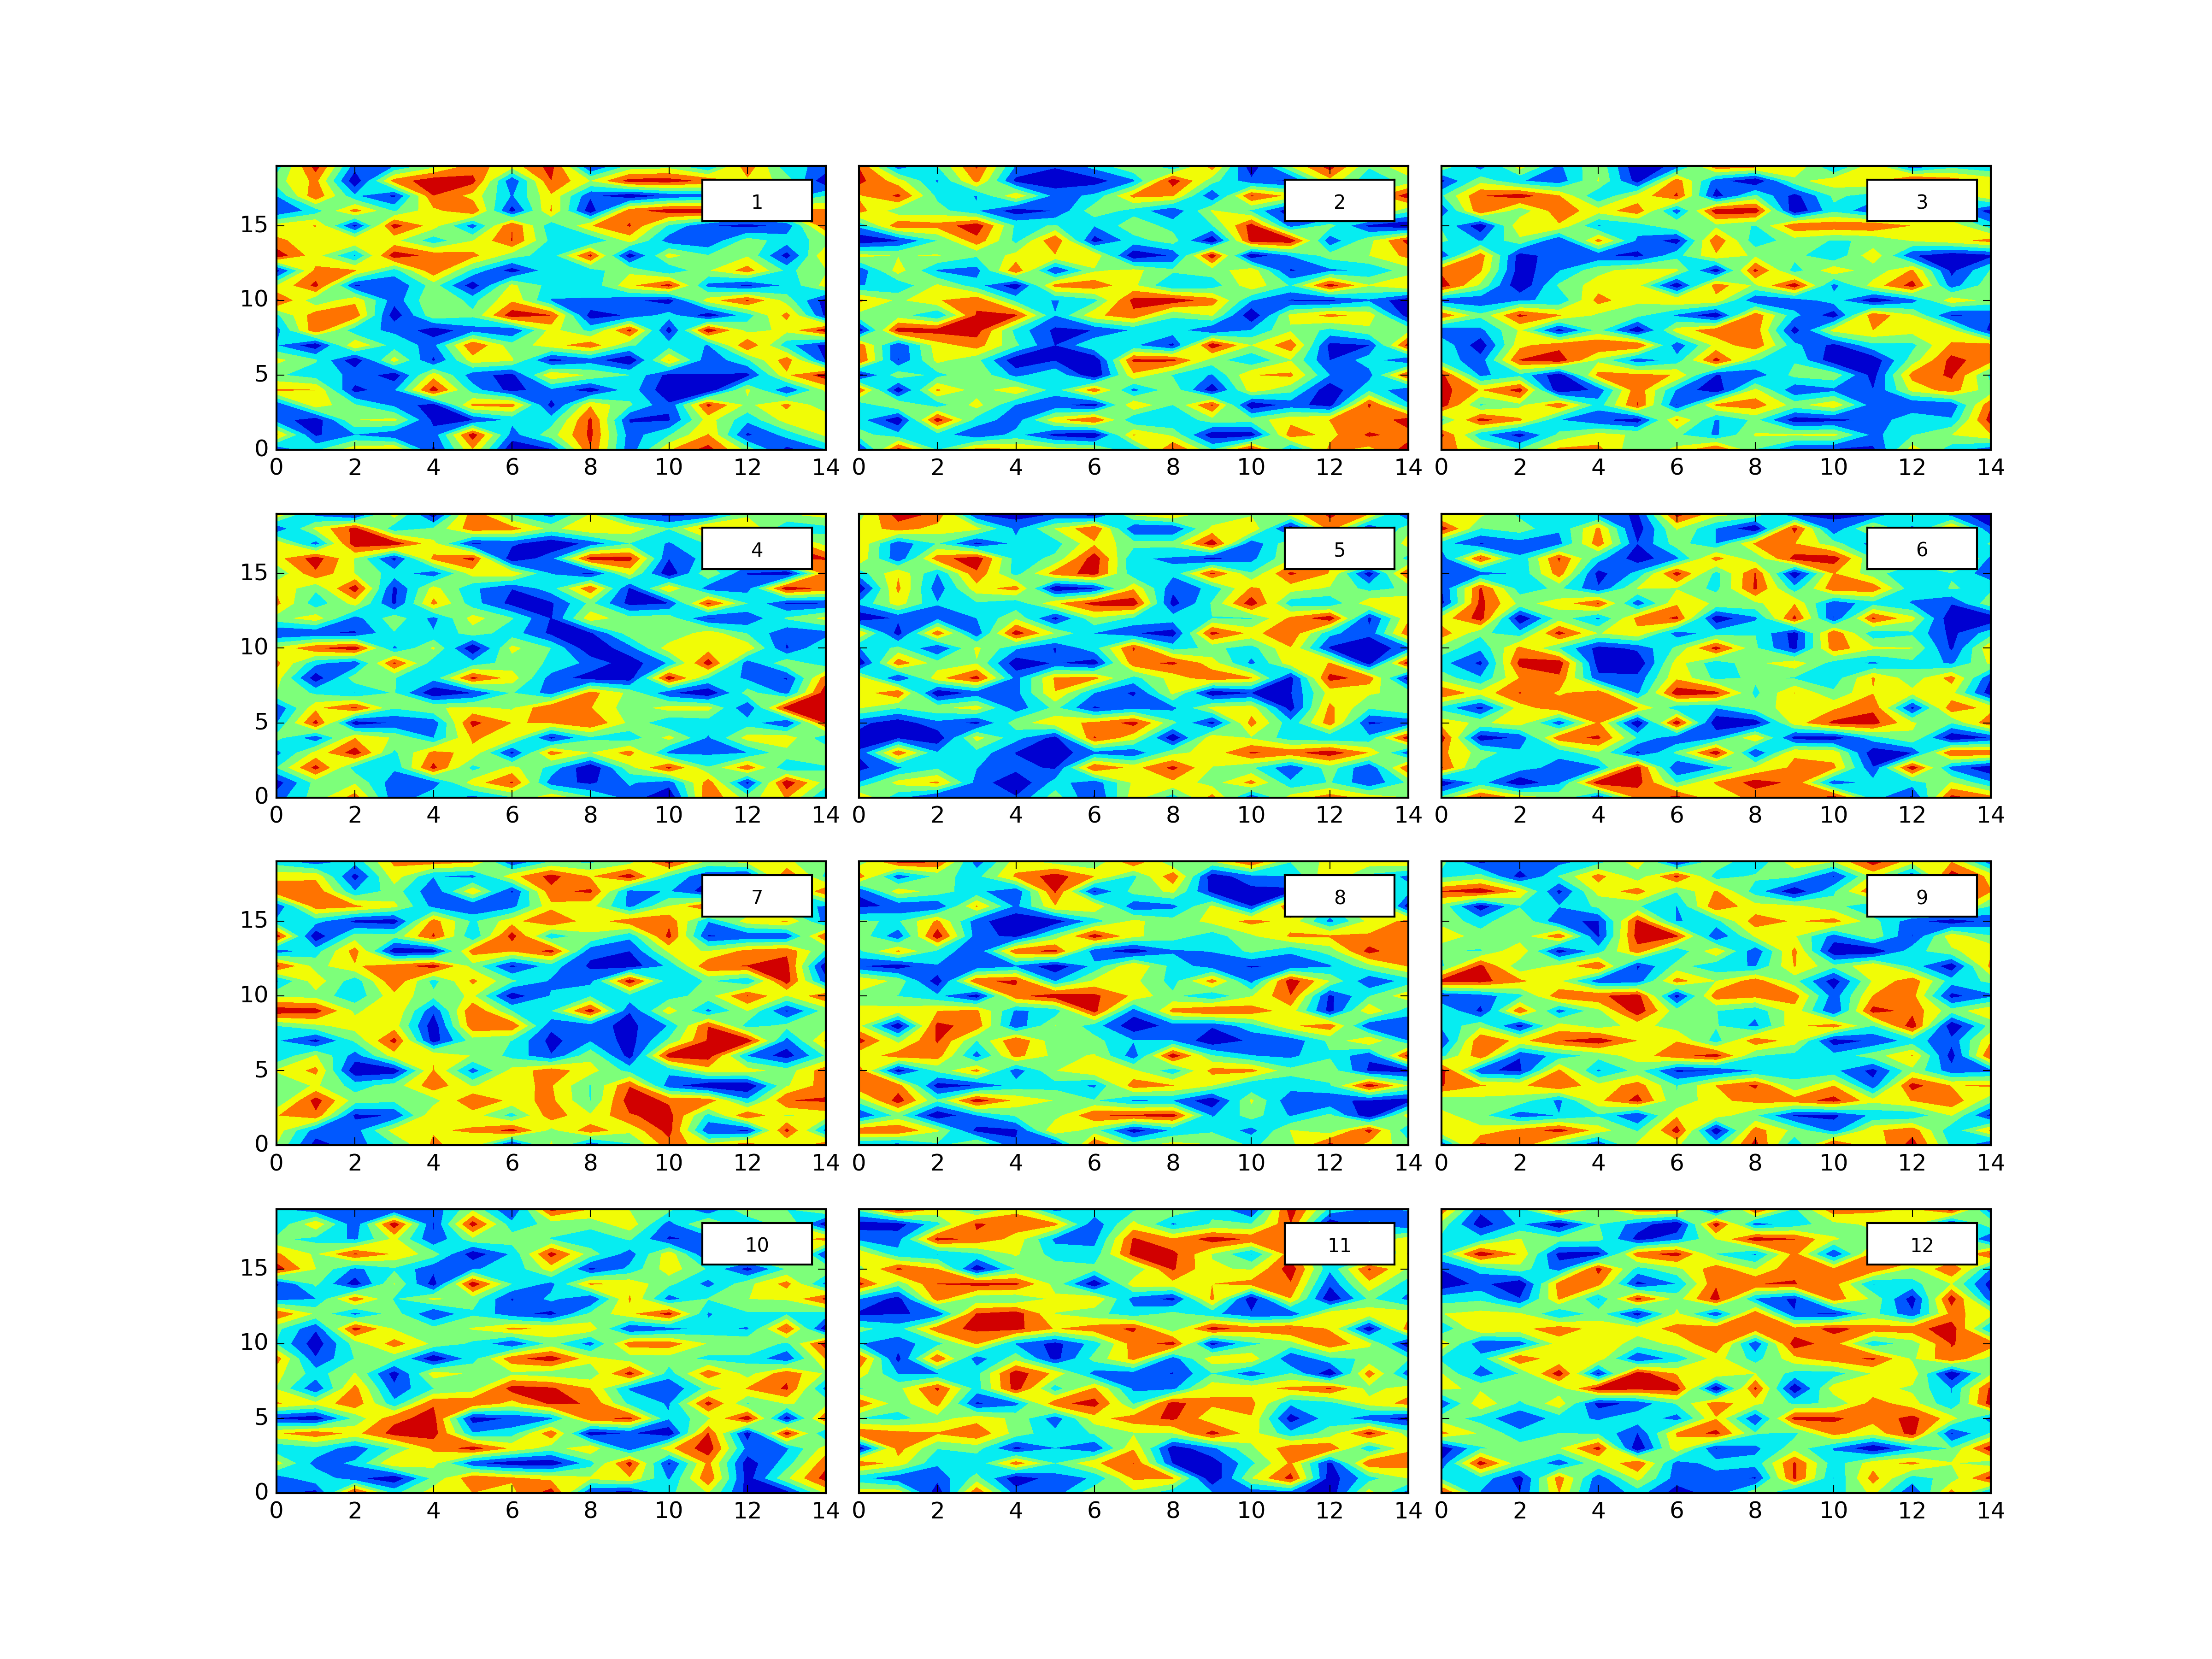
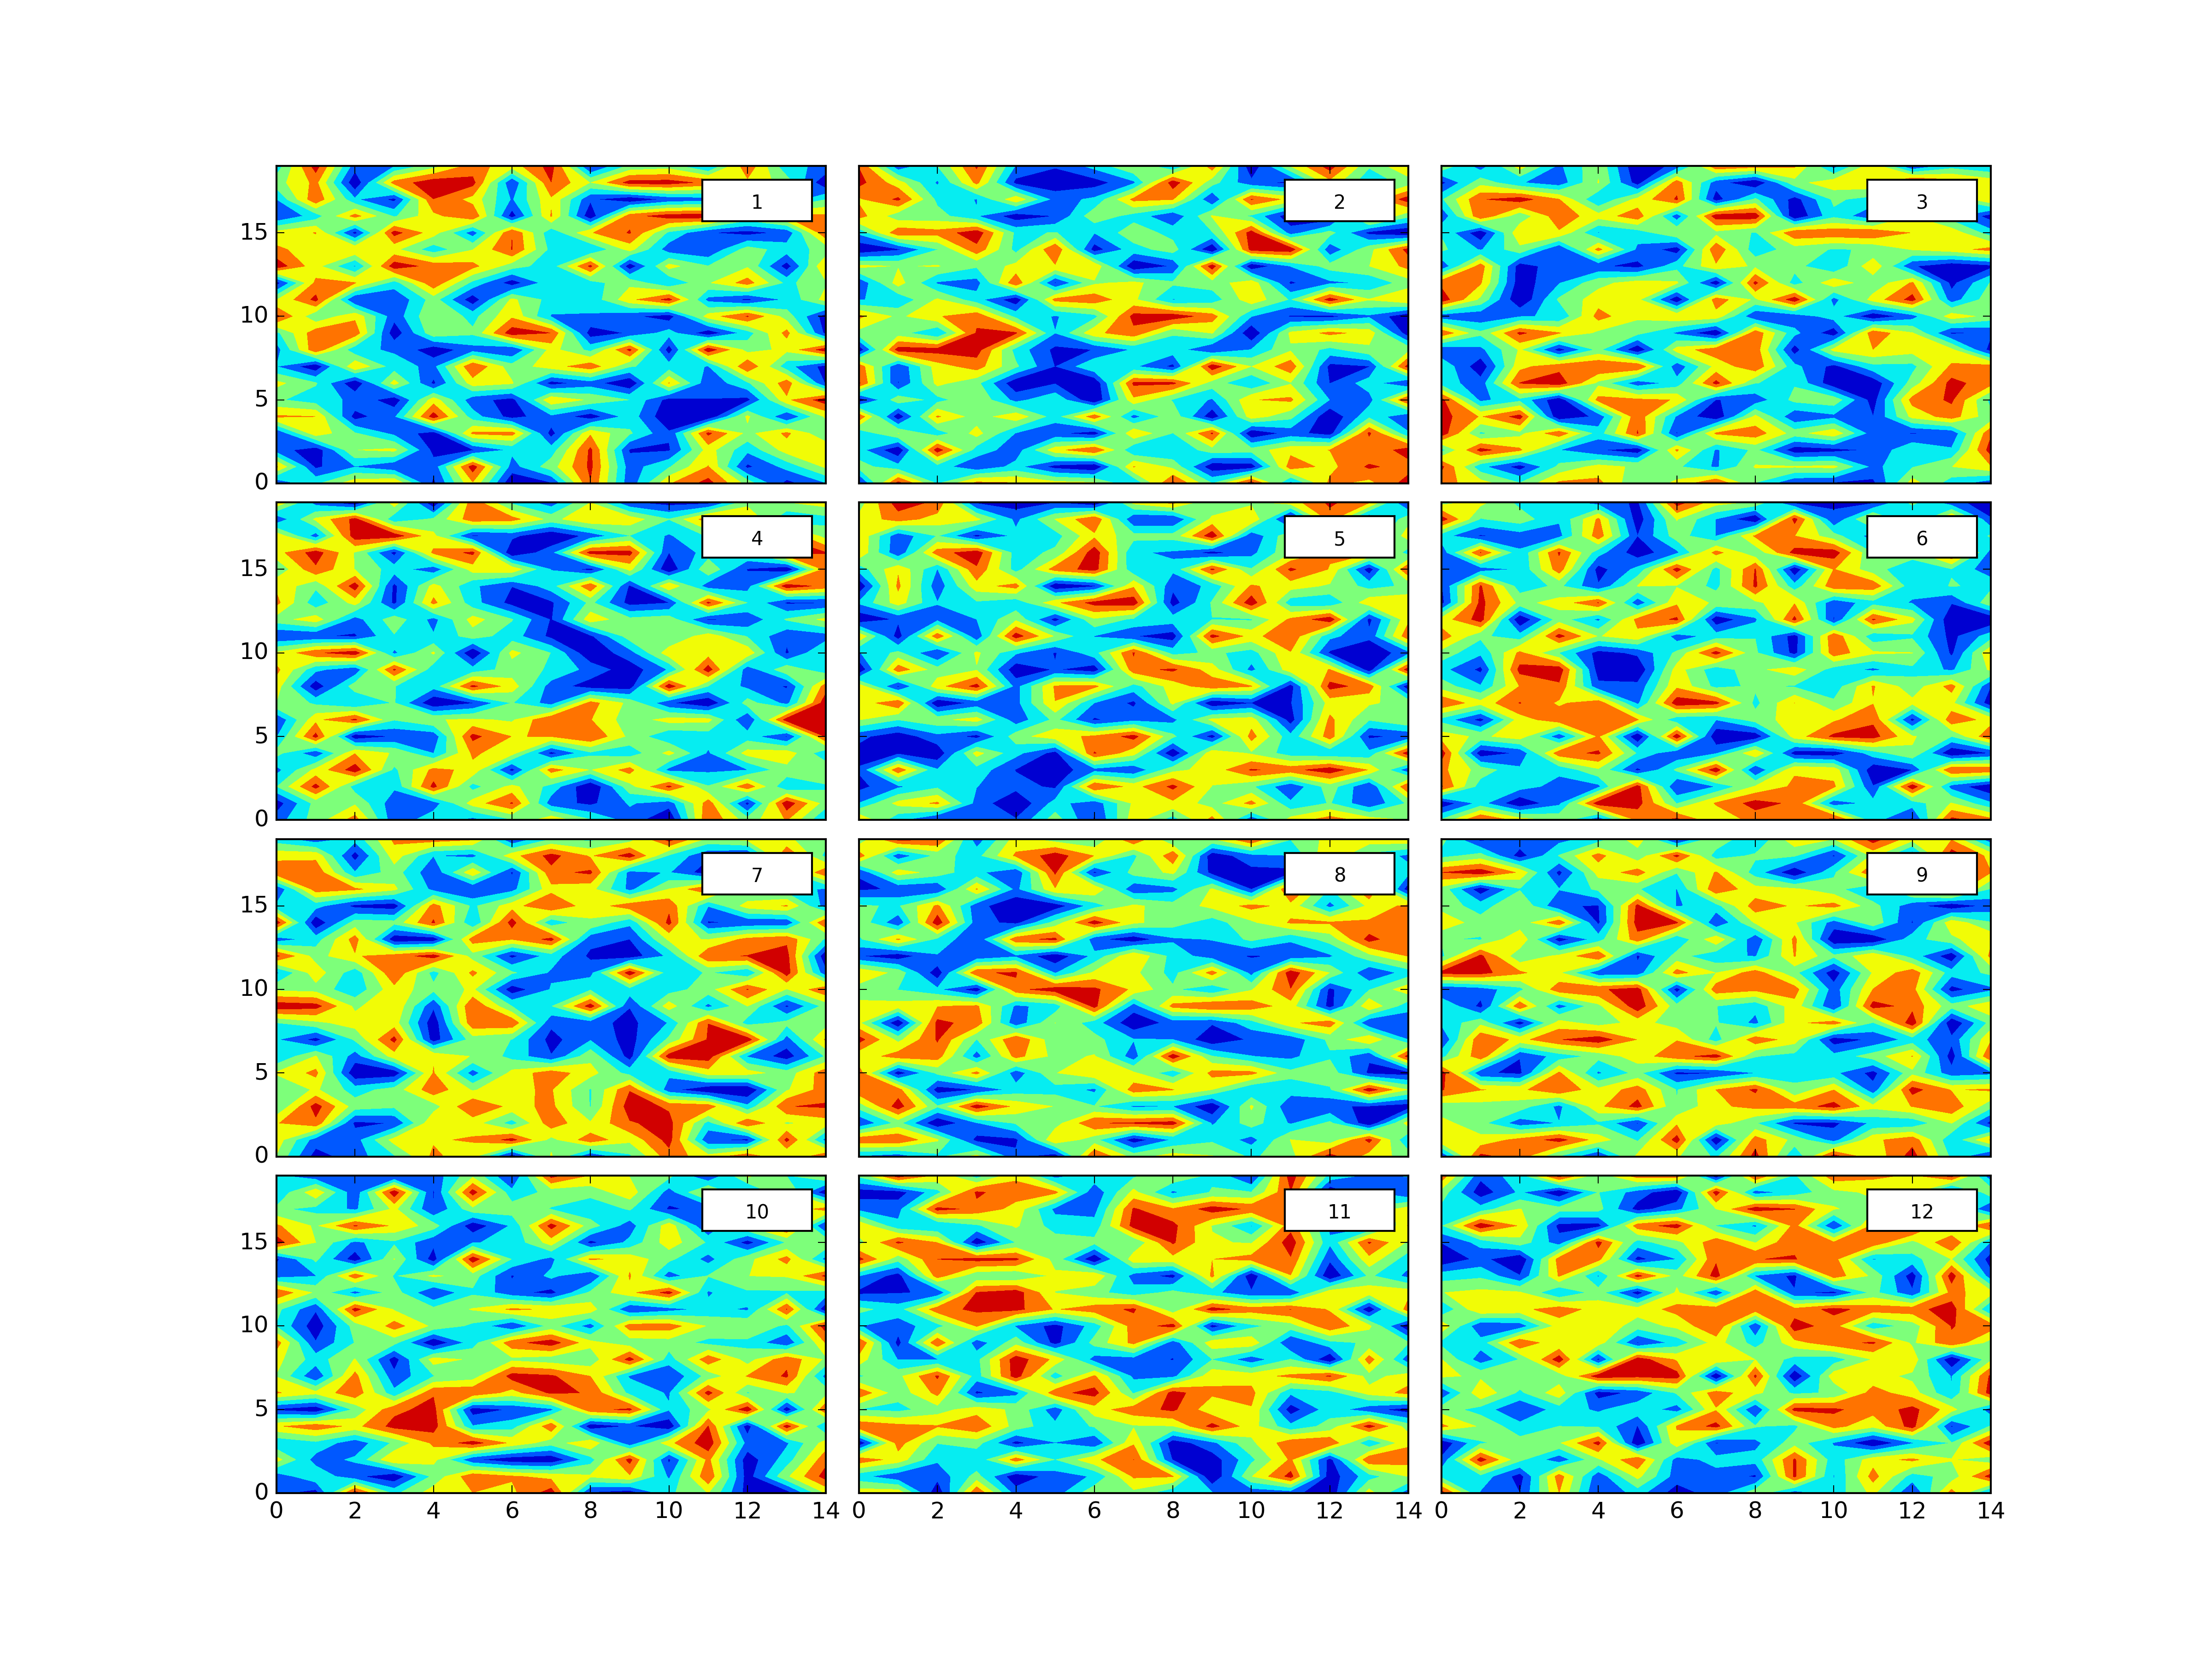
plth.Grid(plotdict,(4,3),dimlabels=dimlab,cbars=colorbars,outputpath=plotoutputs+'002_GridEgDimLabcbars.png')plth.Grid(plotdict,(4,3),dimlabels=dimlab,cbars=colorbars,clevels=8,outputpath=plotoutputs+'003_GridEgDimLabclevelscbars.png')plth.Grid(plotdict,(4,3),dimlabels=dimlab,globalcbar='True',clevels=20,sharex=True,sharey=True,outputpath=plotoutputs+'004_GridEgDimLabShareXShareYglobalcbarclevels.png')plth.Grid(plotdict,(4,3),dimlabels=dimlab,globalcbar='Accent',clevels=20,sharex=True,sharey=True,outputpath=plotoutputs+'005_GridEgDimLabShareXShareYglobalcbarAccentclevels.png')plth.Grid(plotdict,(4,3),sharex=True,outputpath=plotoutputs+'006_GridEgShareX.png')plth.Grid(plotdict,(4,3),sharey=True,outputpath=plotoutputs+'007_GridEgSHareY.png')plth.Grid(plotdict,(4,3),sharex=True,sharey=True,outputpath=plotoutputs+'008_GridEgShareXShareY.png')plth.Grid(plotdict,(4,3),dimlabels=dimlab,outputpath=plotoutputs+'009_GridEgDimLab.png')plth.Grid(plotdict,(4,3),sharex=True,sharey=True,dimlabels=dimlab,outputpath=plotoutputs+'010_GridEgShareXShareYDimLab.png')All of these examples are in tests.py here.
Of course, it’s super hard to create a Class that will work in all instances. I’ve written it with the idea that one could just copy the whole Class in main.py and hack it, if the set up described here is inadequate. Similarly, the Class will return all the matplotlib axis (see self.paxis dictionary). Hopefully it’s a useful starting point though. Pull requests most welcome!
In category: python
